

✌️ Welcome to the latest issue of The Informationist, the newsletter that makes you smarter in just a few minutes each week.
🙌 The Informationist takes one current event or complicated concept and simplifies it for you in bullet points and easy to understand text.
🧠 Sound smart? Feed your brain with weekly issues sent directly to your inbox here
Today’s Bullets:
- What is the Case-Shiller Index?
- How is it constructed?
- How useful is it?
- What else am I looking at to gauge the housing market?
Inspirational Tweet:
*S&P Case-Shiller Apr 20-City Home Price Index Up 21.2% Year Over Year
— *Walter Bloomberg (@DeItaone) June 28, 2022
Wow. At first glance, this Tweet by *Walter Bloomberg, posted a few days ago, would suggest that the housing market is just rocking right now. Right?
*Not exactly*
While the Case-Shiller Home Price Index can be quite useful over long periods, it can be a bit deceiving and misleading at certain times of the housing cycle. And this is one of them.
How? Let’s dig into that today, shall we?
🏡 What is the Case-Shiller Index?
Widely considered the benchmark for the US housing market and prices, there are three main indices: a national home price index, a 20-city composite index, and a 10-city composite index, as well as twenty individual city indices. The one you typically hear quoted in the Wall Street Journal or by analysts is the S&P CoreLogic Case-Shiller U.S. National Home Price (commonly referred to as just the Case-Shiller Index).
The index was developed by economists Karl Case, Allan Weiss, and Robert Shiller back in the 1980s, who created a company to sell their research. This company was eventually bought by Fiserv who, along with Standard and Poor’s, developed tradeable indices based on the data. CoreLogic then bought the research company from Fiserv in 2013, hence the full name is now S&P CoreLogic Case-Shiller U.S. National Home Price.
In simple terms, the Case-Shiller Index measures the change in home prices across the US and is published monthly, but with a slight catch that we will get into later.
🔍 How is it constructed?
First, the indices limit the data to homes that have been sold at least twice in their history. Because there would otherwise be no way to track how a price has changed, new home sales are not included. Also not included are inside sales that may skew the data, like a family member selling to another family member or bankruptcy and foreclosure transactions, for instance. Also, they are only single family homes, not condos or co-ops, etc.
So, the data is limited to a subset of homeowners.
The main national index is a composite of single-family home price indices as measured in the nine U.S. Census divisions. The change in the prices of homes is derived from actual sale prices. There are also weightings according to price changes that can be the result of remodeling, home expansion, or extensive neglect, as well as the time between sales.
And finally, these are all compiled into three-month moving averages to smooth out the data.
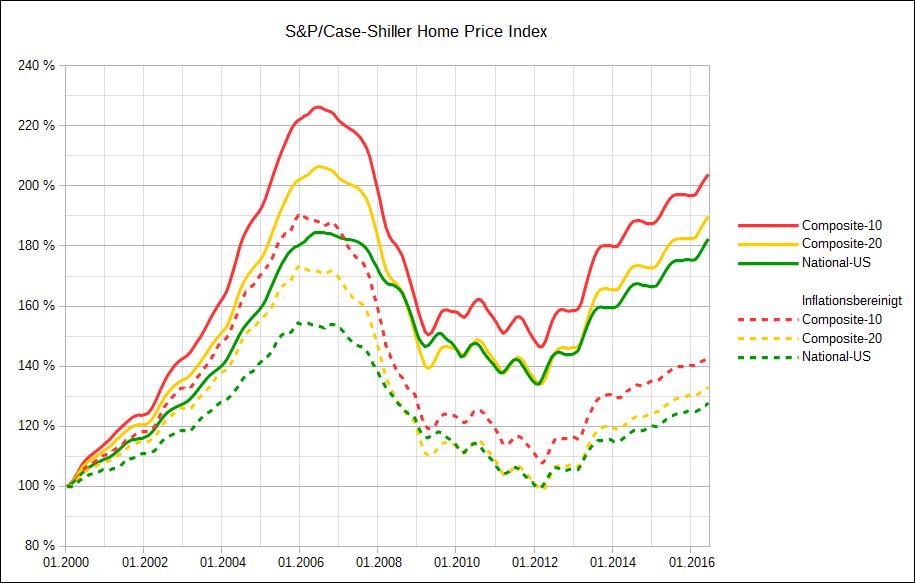
As for the starting point, the S&P version of the indices is normalized to a value of 100 in January 2000, as you can see in the chart below.
*Please note that this example only extends to 2016
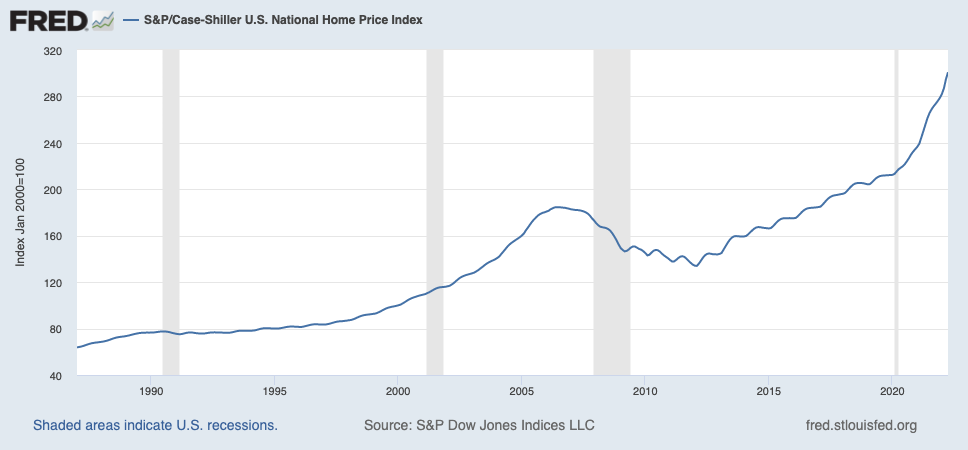
You can see where prices have continued to rise from 2016 to today in the St. Louis FRED chart here (😮!):
✍️ How useful is it?
In theory, the data is critical to understanding exactly what is going on in the housing market, especially as measured in the main sector of single family homes. The housing market itself is a key gauge of consumer health and confidence. After all, most people’s largest investment is in their home itself. When prices are going up, they have more equity in their home and they are more confident in the economy. They borrow more and spend more. For this reason alone, it has become a key indicator and is followed closely by the Fed, economists, and investors alike.
But there is one big flaw that limits the data’s usefulness in the times we need it the most.
There is a two-month time lag in the data reported, so a report issued in March, includes sales through January. And so, back to the *Walter Bloomberg’s tweet above, the data we are seeing today is from April. And this very data is conflicting with other pieces of information we are getting that are suggesting a rapid slowdown in home purchases and a serious downturn in the housing market.
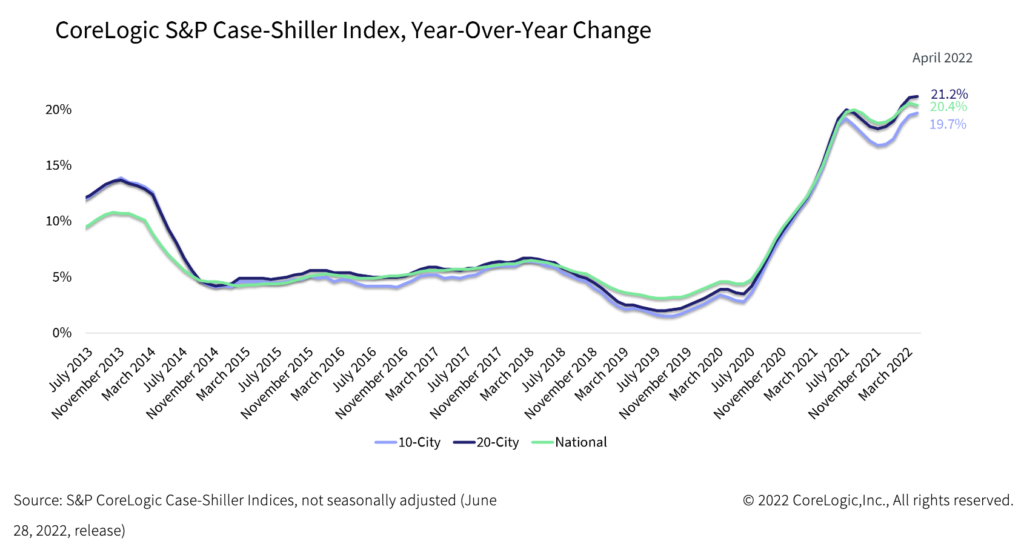
As you can see here on the chart from the S&P website itself, we can tell the national index (bright green line) has begun to slow and rollover from the prior month. But again, this is March to April, and we still haven’t seen data from May or June.
So what can we look at to gain clues that are more timely, more relevant?
🧐 What else am I looking at to gauge the housing market?
As we enter what appears to be a recession, there are a number of more timely data points we can use in order to anticipate what we will see next in the housing market. For instance, hard data points like 30-year mortgage rates are published daily, even intra-day. You can’t get any more timely than that. And when rates are rising rapidly (as they have been), this has the effect of pricing consumers out of the market for certain price ranges of homes.
Why?
Higher mortgage rates = higher monthly payments = difficulty getting loans or inability to make the higher monthly payments
As a result, demand for purchases of homes decreases and prices either they have to be lowered or they don’t sell at all.
And a hard data point that is a direct result of this? Mortgage applications, as published by the Mortgage Bankers Association, published weekly. As evidence of a suspected slowdown already in motion, In the week ending June 10, mortgage purchase applications were down 16% from a year earlier, according to the MBA.
This is obviously in direct opposition to the latest Case Shiller report.
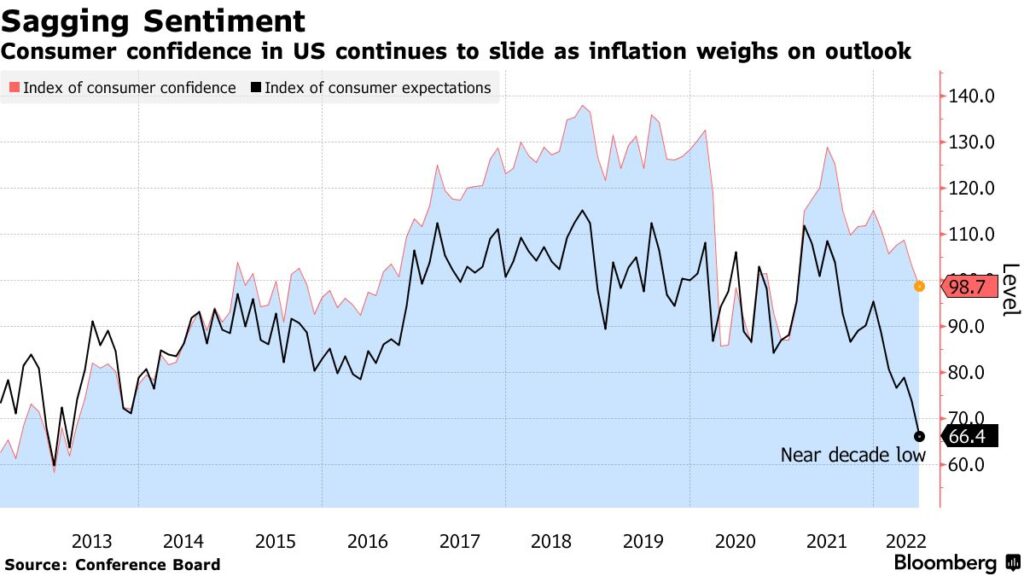
Aside from actual housing data, one good indicator is consumer confidence, as this relates to exactly what we are trying to gauge with the home price index in the first place. Consumer confidence gives us an idea of the strength of buyers’ balance sheets as a whole and whether they feel financially secure enough to commit to buying a house, likely their largest investment.
Once again, the latest data suggests a slowdown already taking place, which will certainly drag on the housing market and prices.
Another indicator I like to look at is auto sales. Why? If consumers are being priced out of buying cars—large ticket items that most often depend on credit and interest rates—they are likely going to also be priced out of buying houses.
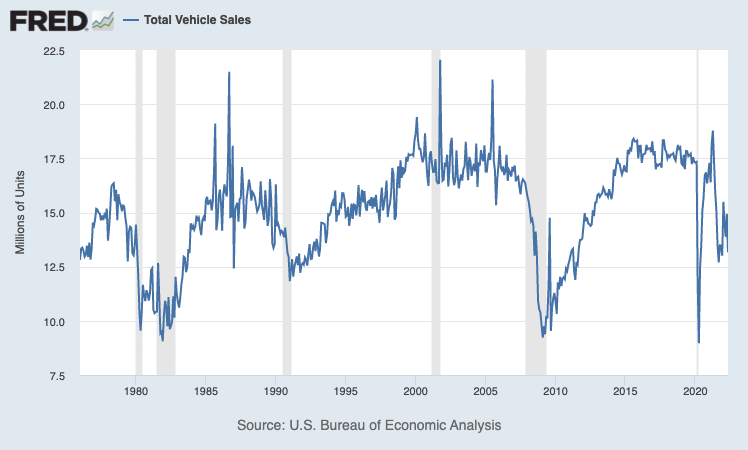
That said, auto sales data is not quite as timely as mortgage rates or even consumer confidence, but certainly more timely than the housing index itself. Other big picture indicators can include unemployment numbers (hard to buy a house if you lose your job), health of the stock market (stocks are often sold in order to use the cash for a down payment on a mortgage), as well as real estate companies (are they laying people off in anticipation of or due to a slowdown in activity?).
The bottom line is, the housing market is a terribly inefficient market that is affected by many factors. Clues to the health and strength of the market are often slow to materialize and even slower to be reported. Because of this, it’s up to you as the investor to assemble as many clues as you can to make a determination for yourself. The Case Shiller index is a good place to start, but if you really want to understand the health of the housing market, you need to keep digging.
This is exactly what I do.
That’s it. I hope you feel a little bit smarter knowing about the Case Shiller Index and are ready to incorporate a few more data points into your own analysis of the housing market before the next time you buy or sell your own house!
As always, feel free to respond to this newsletter with questions or future topics of interest!
✌️Talk soon,
James