

✌️ Welcome to the latest issue of The Informationist, the newsletter that makes you smarter in just a few minutes each week.
🙌 The Informationist takes one current event or complicated concept and simplifies it for you in bullet points and easy to understand text.
🧠 Sound smart? Feed your brain with weekly issues sent directly to your inbox here
Today’s Bullets:
- What is an inverted yield curve?
- How do inversions affect the economy?
- Do inversions signal recessions?
- Where does that leave us today?
Inspirational Tweet:
Worst yield curve since the early 1980s … which was a massive recession.
But back then we had low debt to GDP, below 40% whereas now it is 130%.
Plus in the early 1980s we had an energy production boom coming to ease inflation. pic.twitter.com/SGyaPwUHDW
— Wall Street Silver (@WallStreetSilv) December 8, 2022
As Wall Street Silver points out here, we are seeing the worst yield curve inversion in decades. All signs point to a recession, and the timing and sheer size of the inversion is pointing to a severe one.
But, how and why? What does it all mean?
Grab a cup of Joe, and let’s explore Treasury curves, inversions, and recessions today. And don’t worry, we’ll keep it nice and simple, as always.
👐 What is an inverted yield curve?
We’ve talked about yield curves on The Informationist before, and if you haven’t read that article yet or just want a refresher, you can find it here.
For the TL;DR crowd: the US Treasury yield curve is just taking all the yields of the various maturities of US Treasuries and plotting them on a chart. And in a strong and thriving economy, yields of shorter paper (like 1mo T-Bills to 2yr Notes) are lower than longer paper (say the 10yr to 30yr Treasuries).
And so, it should look something like this:
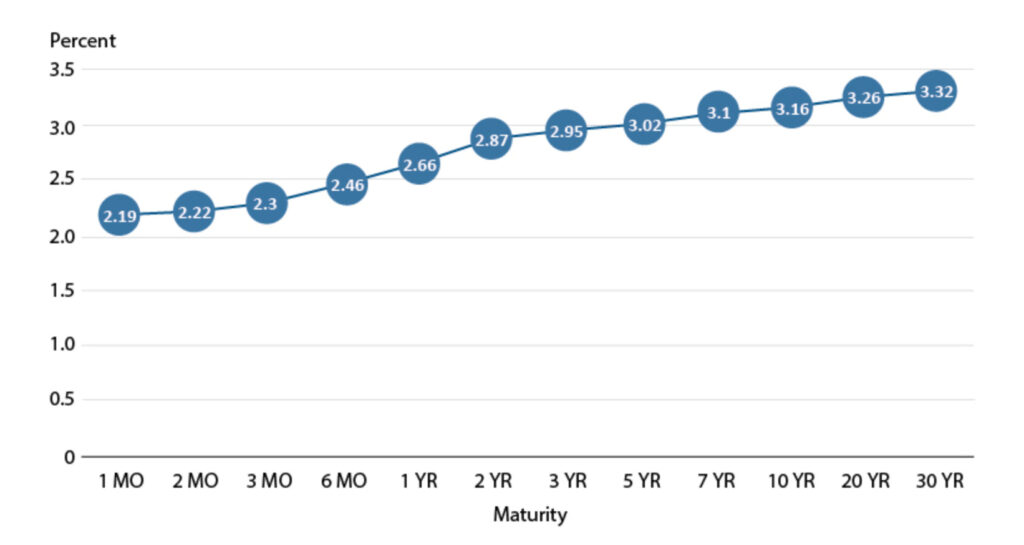
FRED® – Federal Reserve Bank of St. Louis
This is simply because of time value of money and lenders demanding higher rates for committing to parting with their money for longer periods.
But in challenging economic times, the curve may become inverted. I.e., longer maturities yield less than shorter paper.
Why?
Because investors are expecting financial conditions and the economy to worsen. They expect the yields to drop in the future, reflecting this falloff in economic conditions. And as a result, they demand higher prices (and lower yields) when selling those maturities in the market.
And when this happens, the yield curve winds up looking something like this:
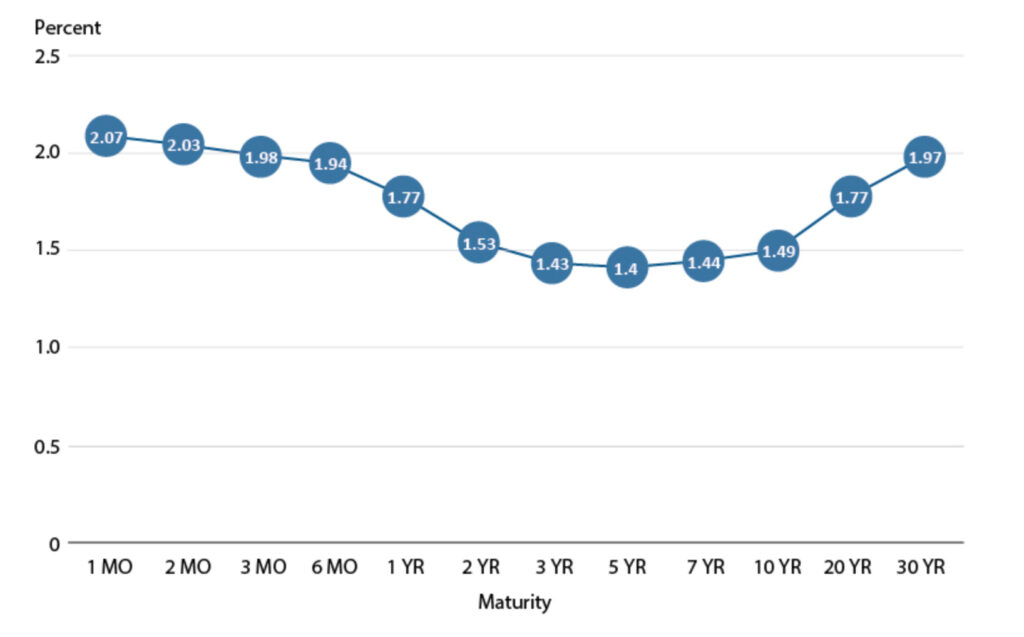
FRED® – Federal Reserve Bank of St. Louis
As you’ve no doubt suspected (and likely heard recently), UST yields look more like the second chart these days, indicating expectations of an economic slowdown, or worse, a recession.
In fact, the plot is looking downright dismal these days, with an inverted curve that’s as steep as El Capitan’s cliff face.
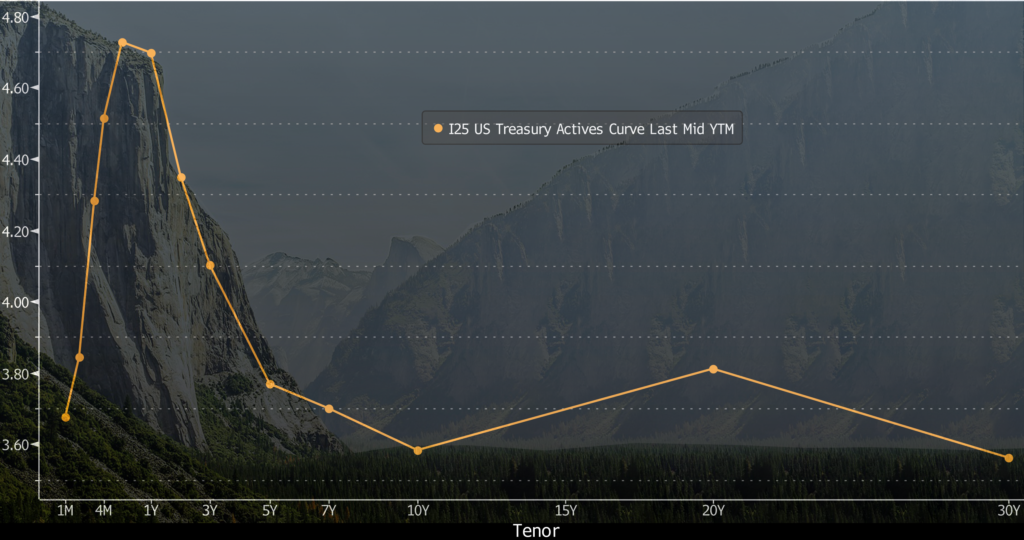
Bloomberg Professional + Wikipedia Commons
Does this mean we are doomed? Let’s keep looking…
🧐 How do inversions affect the economy?
First and foremost, the reality of inverted yield curves is that they can create difficult lending environments for banks, and hence, difficult borrowing periods for consumers.
How?
Well, think of it this way. Banks borrow at shorter maturities (think overnight lending rates), and they lend the largest amounts at longer ones (think mortgages). And so, when rates are higher on the short end and lower on the long end, bank margins are squeezed and they face challenges to make money.
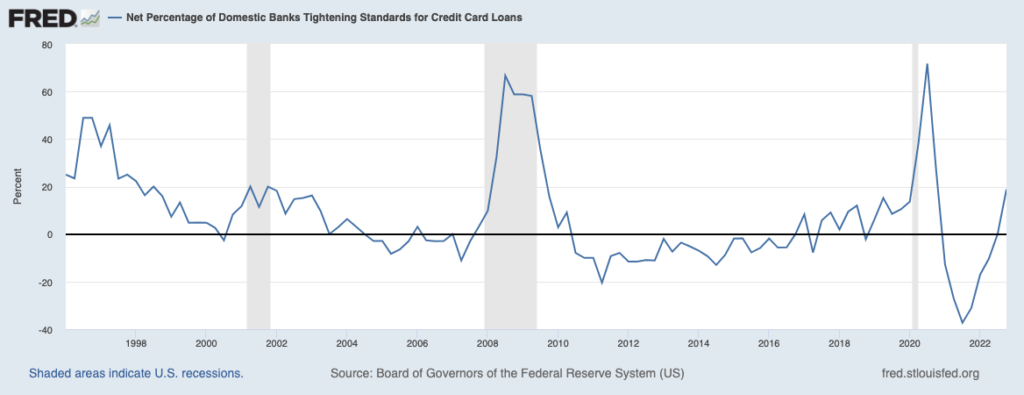
As for consumers, adjustable rate mortgages, home equity lines of credit, personal loans and lines of credit, and credit card interest rates are all keyed off the short-term interest rates. All these rates are pushed higher with an inverted yield curve.
Payments go up for consumers.
Also, for banks borrowing, they become less willing to lend with the reduced spreads, only perpetuating the borrowing problem for many consumers.
Like so…
Question is, which comes first, the inversion or the recession?
🤔 Do inversions signal recessions?
Knowing what we just covered above, it would seem to make sense that inversions both induce and indicate incoming recessions.
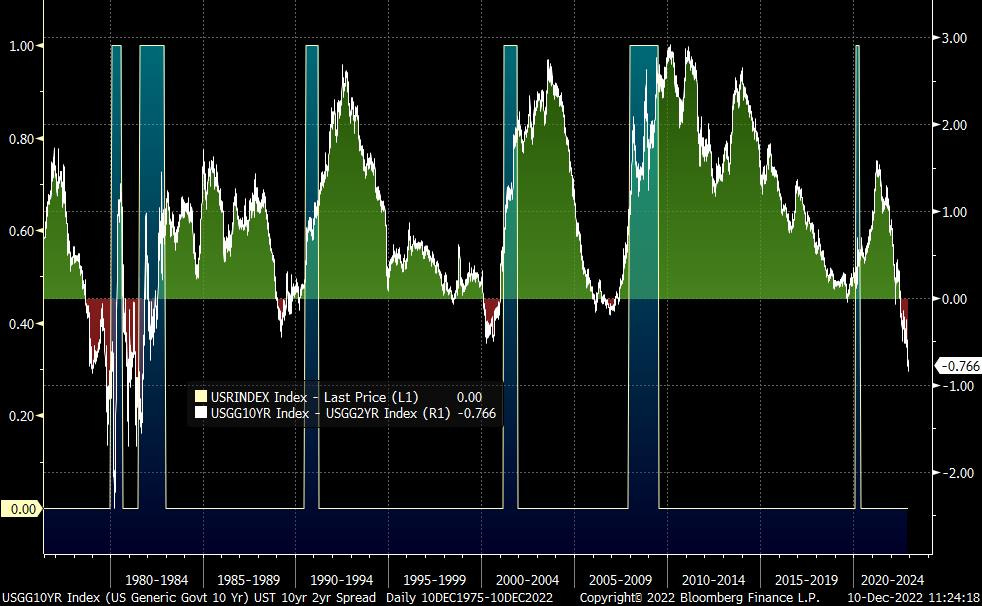
Low and behold, looking at the benchmark 10yr / 2yr UST spread, we can clearly see that inversions occur before the official onset of every recent recession (shaded areas), even slightly ahead of the recession in 2020:
And if we look at the 10yr / 3mo UST spread, which has been the leading spread indicator for recessions, we see strong inversions before every single modern day recession, including 2020.
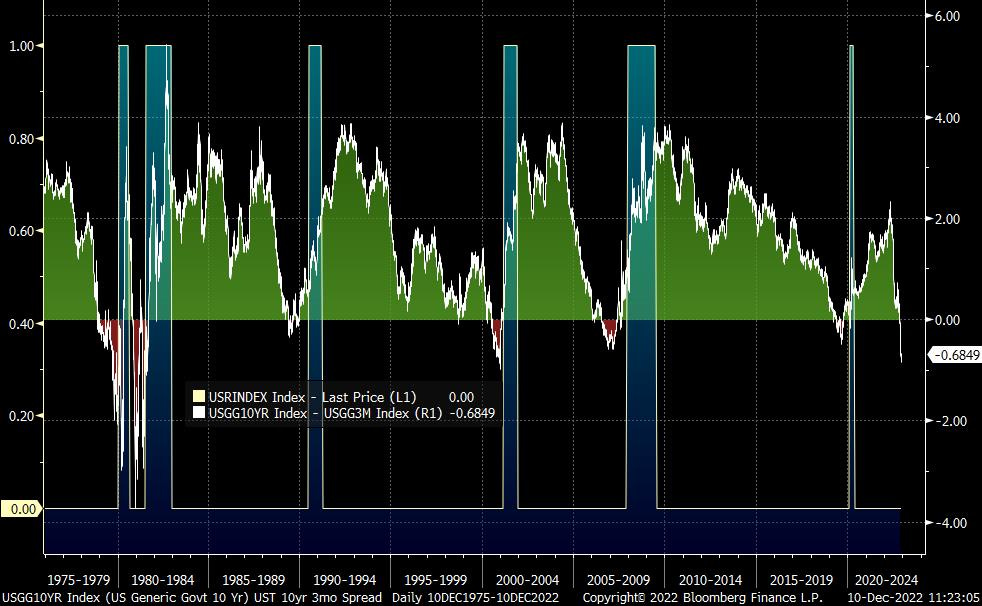
The evidence appears indisputable, and looking at the 10yr / 3yr spread, in particular, the warnings become clear about one to two years before each onset.
🤨 Where does that leave us today?
Unfortunately, as Wall Street Silver points out above, we have a few seriously negative indicators and factors that favor a deep recession looming ahead.
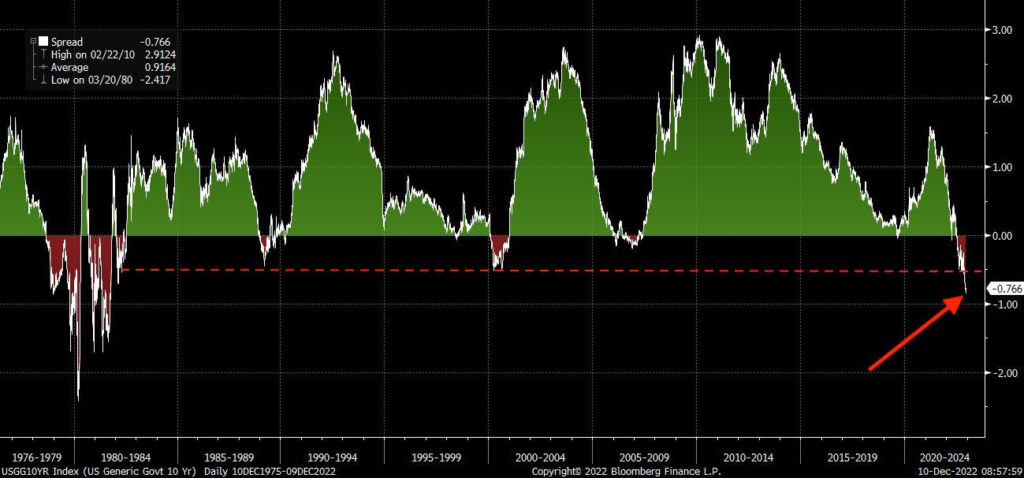
First, while both of the above spreads are negative, the spread of the 10yr / 2y USTs is the widest negative reading it has been since the 1980s.
Second, as WSS also points out, total US debt to GDP has ballooned to over 130%. Far worse than the 30% or so level that it sat at back in the 1980s.
Why does this matter?
Well, if you’ve been listening to me (and others) on Twitter lately, or if you’ve been reading The Informationist, you’ve undoubtedly heard me pointing out how the US now finds itself in what we call a debt spiral.
If you haven’t read that, or want more context, you can find a summary of the article in a recent Twitter thread, right here:
If you’ve never heard of a *debt spiral*, it’s time you did,
and ask the question, "is the US already in one?"
Let’s dig in and answer that.
A debt 🧵👇
— James Lavish (@jameslavish) August 23, 2022
Bottom line, as the US faces a recession, which means falling GDP and hence falling tax revenues, while at the same time it is borrowing over $1T per year already (before this recession-induced downward adjustment), the Treasury will be forced to borrow even more, go further into debt, further into annual deficit.
Not good, my friends.
But what choice does the Fed have other than to keep rates high to fight persistent inflation (caused by money expansion – read: printing) and continue to keep the yield curve inverted?
Like WSS said above, we have no coming energy expansion to help fight inflation. So, the Fed will keep tightening. Keep raising short-term rates.
They are essentially trying to out-manipulate their past manipulations.
I personally don’t believe it will work, though.
There will be no soft landing. There will be no avoiding a recession. The market is telling you this, the inversions are telling you this.
So, at the worst, we will have a deep recession or even depression.
At the best, we will have a short-lived recession.
Either way, the Fed will reverse course. They will lower rates. They will stop selling the USTs and MBS on their balance sheet. They will most likely be forced to step in and provide liquidity to the Treasury market, to keep it orderly, functioning properly.
Manipulate more. Print more. Debase the USD more.
So what can you do?
Be careful of your exposures, and in my personal opinion, holding some cash in the uncertainty ahead is sensible. And adding opportunistically to hard money assets, like gold, silver, and Bitcoin is wise for the long term.
These will all perform well when the market eventually turns to the upside, and especially when the Fed realizes it has no choice but to expand the money supply once again.
That’s it. I hope you feel a little bit smarter knowing about yield curves and their usefulness in predicting recessions!
As always, feel free to respond to this newsletter with questions or future topics of interest. And if you want daily financial insights and commentary, you can find me on Twitter!
✌️Talk soon,
James