
✌️ Welcome to the latest issue of The Informationist, the newsletter that makes you smarter in just a few minutes each week.
🙌 The Informationist takes one current event or complicated concept and simplifies it for you in bullet points and easy to understand text.
🧠 Sound smart? Feed your brain with weekly issues sent directly to your inbox here
Today’s Bullets:
What is the yield curve?
What does it mean when it’s inverted?
What is yield curve control (YCC)?
And how does the EuroDollar fit into all this?
Inspirational Tweet:
Every yield curve "situation" has a series of people explaining why the yield curve doesn't matter this time, or arguing over which specific yield curve to care about.
See thread and charts below.
— Lyn Alden (@LynAldenContact) March 22, 2022
As Lyn explains in this thread: “…the 10-2 curve is saying, ‘we’re probably getting close to a possible recession, but not confirmed, and probably many months away,…’”
Let’s break that down a bit, shall we?
⤴ What is the yield curve?
First of all, what exactly is the yield curve that everyone seems to be talking about lately, and how is it tied to inflation, The Fed, and possible recession?
The yield curve is basically a chart plotting all the current nominal (not including inflation) rates of each government issued bond. Maturity is the term for a bond, and yield is the annual interest rate that a bond will pay the buyer.
A normal yield curve (this one from 2018) chart will typically look like this:
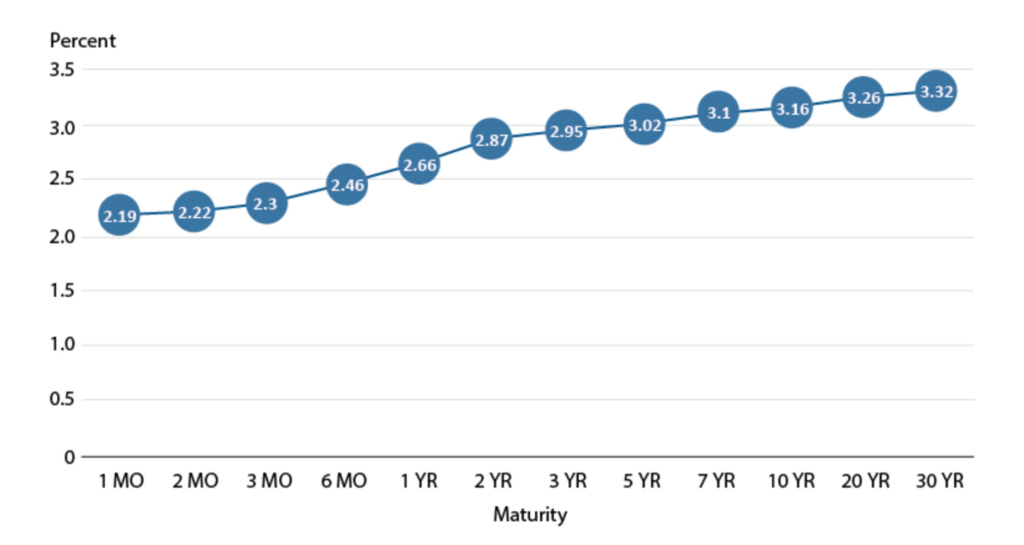
SOURCE: FRED®, Federal Reserve Bank of St. Louis
The Fed sets what is called the Fed Funds rate, and this is the shortest interest rate you can get a quote on, as it is the rate (annualized) that the Fed suggests commercial banks borrow and lend their excess reserves to each other overnight. This rate is the benchmark that all other rates are priced from (or so, in theory).
As you can see, in a normal economic environment, the shorter the maturity of the bond, the lower the yield. This makes perfect sense in that, the shorter the time committed to lending money to someone, the less interest you would charge them for that agreed lockup period (term). So, how does this tell us anything about future economic downturns or possible recessions?
That’s where yield curve inversion comes into play and what we will tackle next.
⤵ What does it mean when it’s inverted?
When shorter term bonds, like the 3 mo or 2yr, start to reflect a higher yield than longer term bonds, 10 yr or even 30 yr, then we know there is expected trouble on the horizon. Basically, the market is telling you that investors are expecting rates to be lower in the future because of an economic slowdown or recession.
So, when we see something like this (i.e., August 2019):
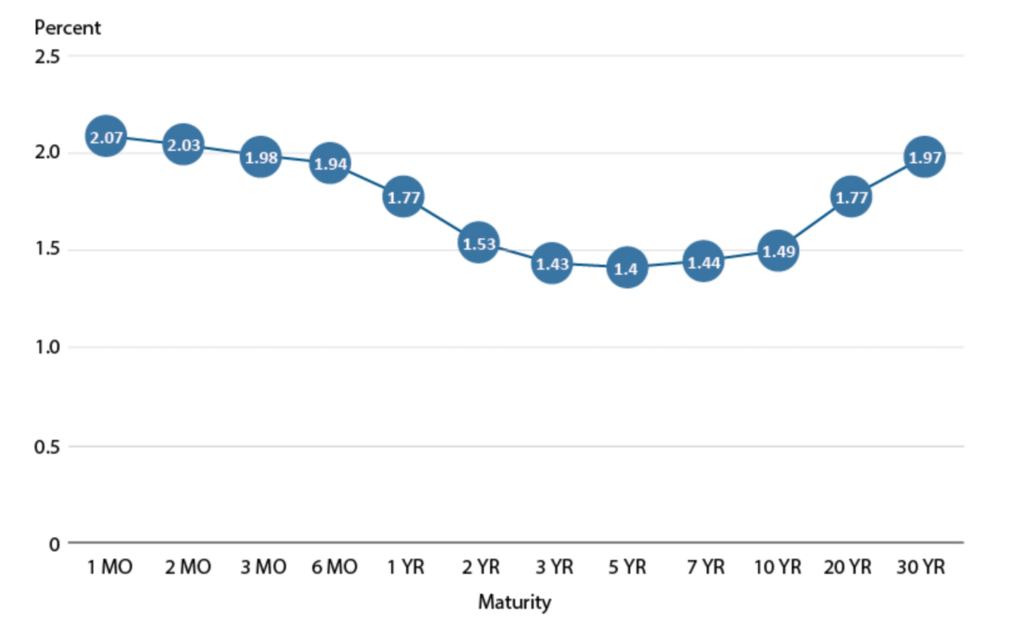
SOURCE: FRED®, Federal Reserve Bank of St. Louis
…where the 3 mo and 2 yr bonds are yielding more than the 10 yr, investors start to get nervous.
You will also sometimes see it expressed like this, showing the actual spread between the 2 yr and the 10 yr interest rates. Notice the momentary inversion back in August, 2019 here:
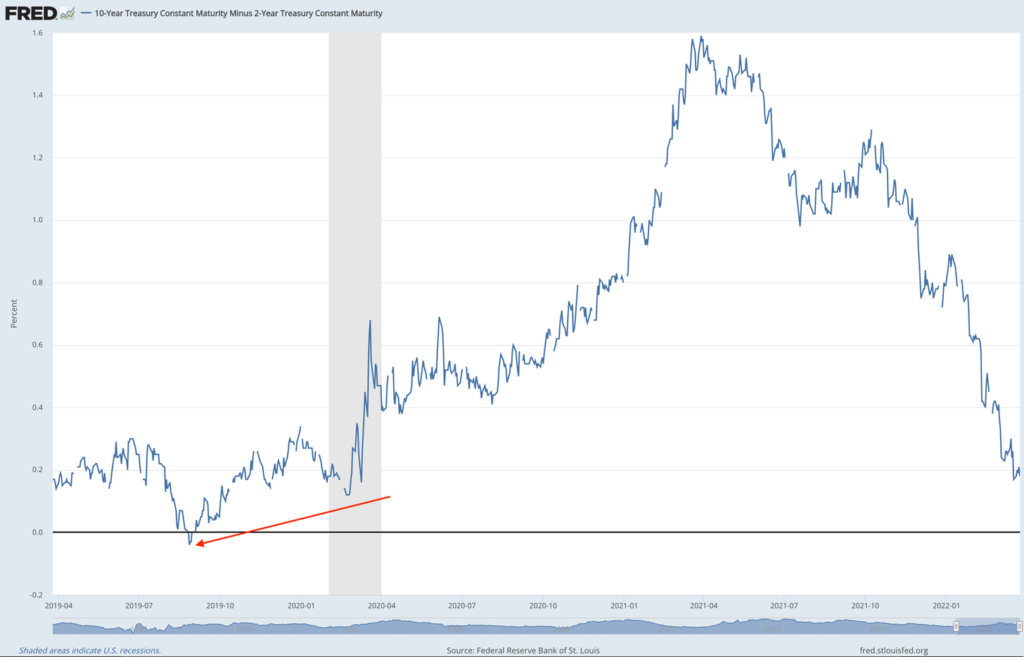
Why does it matter so much, if it is just an indication and not a reality yet?
Because inversion not only shows an expected downturn, but can actually wreak havoc in the lending markets themselves and cause problems for companies, as well as consumers.
When short term rates are higher than long term, consumers who have adjustable-rate mortgages, home equity lines of credit, personal loans, and credit card debt will see payments go up because of the rise in short term rates.
Also, profit margins fall for companies that borrow at short-term rates and lend at long-term rates, like many banks. This spread collapsing causes a sharp downturn in profits for them. So they are less willing to lend at a reduced spread, and this only perpetuates borrowing problems for many consumers.
A painful feedback loop for all.
🕹 What is Yield Curve Control (YCC)?
No surprise, the Fed has an answer to all this (don’t they always? 🙄), in the form of what we call yield curve control. This is basically the Fed setting a target level for rates, then entering the open market and buying short term paper (1 mo to 2 yr bonds, typically) and/or selling long term paper (10 yr to 30 yr bonds).
The buying drives the short term bond interest rates lower and the selling drives the long term bond interest rates higher, thereby normalizing the curve to a ‘healthier’ state.
Of course, there’s a cost to all this with the likely expansion of the Fed’s balance sheet and further expansion of the money supply, especially when the open market does not participate at the level necessary for the Fed to achieve its targeted rates.
Result? Possible exacerbated inflation, even in the face of a contracting economy. Which is what we call stagflation. Unless the control of the curve helps head off a pending recession, and economic expansion resumes. A big “if”.
💶 What is the EuroDollar and how does it fit into all this?
A Eurodollar bond is a US Dollar denominated bond issued by a foreign company and held in a foreign bank outside both the US and the issuer’s home country. A bit confusing, as the prefix ‘Euro’ is a blanket reference to all foreign, not just European companies and banks.
More importantly, and in our context here, Eurodollar Futures are interest-rate-based futures contracts on the Eurodollar, with a three-month maturity.
To put it simply, these futures will trade at what the market expects US 3-month interest rate levels will be in the future. They are an additional data point and indicator of when the market expects interest rates to peak. (This is also known as the terminal rate of the Fed cycle.)
For instance, if the December 2023 Eurodollar contract show an implied rate of 2.3% and the rates declining to 2.1% in the March 2024 contract, then the expected peak for the Fed Funds rate would be at the end of 2023 or early 2024.
Simple as that, and just another place to look for clues of what investors are thinking and expecting.
OK, that’s it. I hope you feel a little bit smarter having learned all about yield curves, inversion, yield curve controls, and even Eurodollars today.
As always, feel free to respond to this newsletter with questions or future topics of interest!
✌️Talk soon,
James