
✌️ Welcome to the latest issue of The Informationist, the newsletter that makes you smarter in just a few minutes each week.
🙌 The Informationist takes one current event or complicated concept and simplifies it for you in bullet points and easy to understand text.
🧠 Sound smart? Feed your brain with weekly issues sent directly to your inbox here
Today’s Bullets:
- Auction Terms and Basics
- The Good, the Bad, and the Ugly
- Total Fail
- USTs vs. Hard Money
Inspirational Tweet:
If you wonder why nominal rates are rising so relentlessly even as inflation expectations fall, well, look at this. 🧵 pic.twitter.com/CdcuGTukMS
— Jurrien Timmer (@TimmerFidelity) September 29, 2022
As Jurrian points here, bond yields are rising even as inflation expectations are falling. One would expect the opposite to happen, as inflation easing means the Fed won’t have to raise rates quite as much as markets fear, and so yields should fall accordingly.
But that’s not the case. Why?
As Jurrien also points out, one reason may be that demand for US Treasuries has all but dried up. Which then begs the question, what happens if a bond auction for USTs fails, and what exactly does that mean?
Let’s walk through it, easy as pie (not π), shall we?
👋Auction Terms and Basics
What we’re talking about here today are auctions hosted by the US Treasury to sell bonds in order to finance the public debt.
Treasuries are named according to their term (length of maturity):
- Treasury bills have terms shorter than 1 year are called (or T-bills);
- Treasury notes are shorter than 10 years (Notes),
- Treasury bonds exceed 10 years (Bonds),
- and then there are Treasury Inflation Protection Securities (TIPS) and Floating Rate Notes (FRNs) with various maturities.
*Some slang clarification. These can all be referred to as *bonds*, but traders never refer to anything above 10-years as a *note*.
Treasury auctions occur pretty regularly, on a set schedule. About 300 public auctions are held each year, and as you can see here, the US Treasury has auctioned about $11.2T of bonds, so far, in 2022.
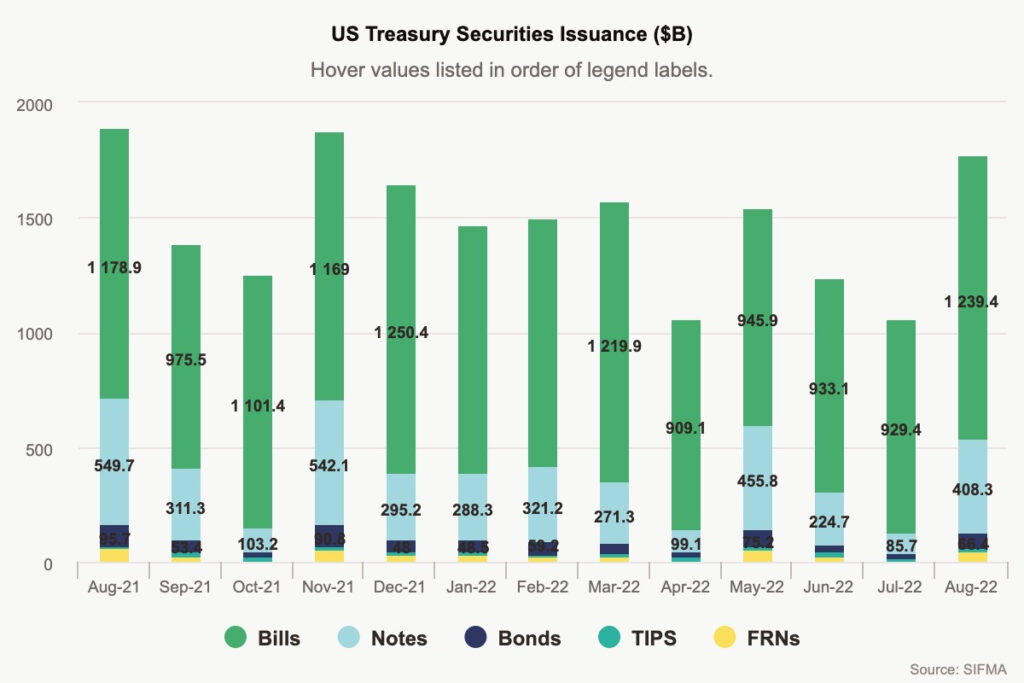
Big business. One that needs a lot of demand to keep this whole debt charade going.
OK, onward.
So, let’s clear a few terms and definitions (don’t worry, we’ll keep it easy and clear here), along with the general rules, so we can better understand what actually happens during an auction.
First, to participate directly in an auction, a bidder must have an established account. Institutions use TAAPS (Treasury Automated Auction Processing System) and individuals use a TreasuryDirect account.
Individuals can only place non-competitive bids, where they agree to accept whatever discount rate (yield) is set by the auction.
Institutions can place either non-competitive or competitive bids, where the bidder specifies an interest rate they are willing to accept.
Institutions can also trade in advance of an auction, and then settle with each other when the auction happens. This is called the when-issued market and is pretty important to our discussion, so we’ll talk more about that in a bit.
Back to the auction itself.
Once an auction begins, the Treasury first accepts all non-competitive bids and then conducts an auction for the remainder of the amount it is looking to raise. This is where competitive bidders are unsure whether they will be filled at their price or not.
The process is called a Dutch auction.
For example:
Let’s say the Treasury wants to raise $100 million in 10-year Notes with a 4% coupon.
Let’s also say it receives $10 million of non-competitive bids.
The Treasury first accepts all these non-competitive bids and reduces the amount left for the Dutch auction to $90 million.
If it then receives the following competitive bids:
- $25 million at 3.88%
- $20 million at 3.90%
- $30 million at 4.0%
- $30 million at 4.05%
- $25 million at 4.12%
The bids with the lowest yield will be accepted first and then ascend up until the auction is filled. In this case, because the Treasury needs to raise $100 million total, after accepting the $10 million of non-competitive bids, it then accepts all competitive bids up to 4.0% ($75 million) and only $15 million of the 4.05% bids for a total of $90 million.
So, those who bid 4.05% would receive half of their orders filled.
At the end of the auction, all bidders receive the same yield at the highest accepted bid.
In this case, $100 million of Treasuries were auctioned off at 4.05%.
On the face of it, this looks pretty bad, as the Treasury had to offer a higher yield to raise its target amount.
But how bad? And how can we tell?
Good questions and the answer—per usual with Wall Street—lies in the expectations of pricing. Let’s turn to the metrics of an auction next to find out how.
🤨The Good, the Bad, and the Ugly
Bid to Cover
One of the first things traders and investors look for is called the Bid to Cover ratio (sometimes just referred to as BTC). A pretty simple statistic, this is just the total amount of bids received divided by the amount of bond face value of an auction.
In the case above, the total bids amounted to $140 million and the auction was for $100 million of Notes, so the BTC ratio would be 1.4x.
Like many stats, though, what we are often looking for here is a change from prior periods. Is the BTC ratio rising or falling? And how rapidly? If liquidity is drying up in the markets, this would be a pretty good first indicator. If it drops low enough, it’s a major red flag.
More on that in a minute.
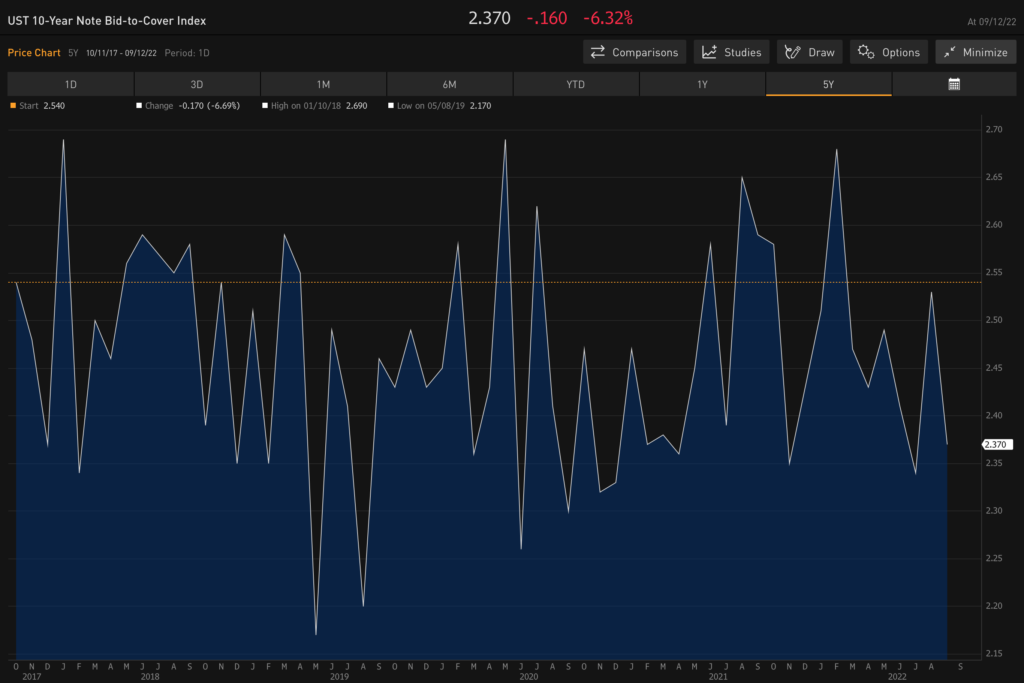
Looking at the release of stats from this week’s US 10-year Note auction, we can see at the bottom, in the footnotes, that this auction had a 2.37 BTC ratio.
And looking at recent 10-year Treasury Note auctions, we see this is largely in line with the BTC we have been seeing, so no red flags here.
Bloomberg Professional
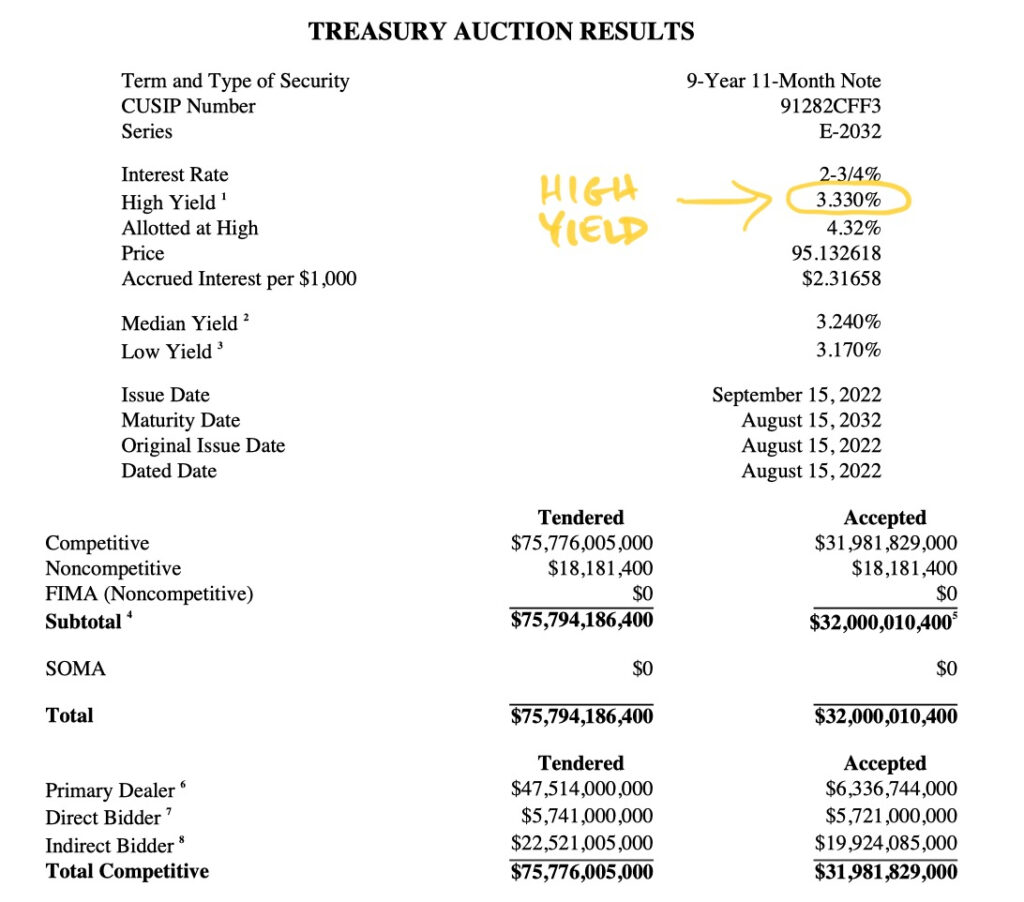
The High Yield
Another, usually much more important, metric to keep an eye on is the high yield (also called the stop)—the actual yield received by bidders in the auction.
Two things we are looking for here.
Remember how we said these securities trade in a when-issued market before and leading up to an auction? This creates what is called the snap price. It sets the price expectations for an auction and is a critical piece of information for investors.
So, first, was the auction overbid or underbid?
In a case of overbidding, the stop price (high yield) would be lower than the snap price (when issued yield), and this is usually seen as a solid auction. With underbidding, the stop would be higher than the snap, indicating a weak auction.
To put it simply, the snap (when-issued) tells us how the bond traded leading up the auction, and the stop (high yield) tells us how strong the auction was itself.
The Auction Tail
The second thing we’re looking for with the high yield, and a bond-fan favorite is called the auction tail.
The tail is the high yield minus the bond’s when-issued yield.
If there is no measurable tail, we say that the auction finished on the screws. A negative tail means that the auction went better than expected, with higher-than-expected demand.
But positive tail tells us the auction did not go well because the yield realized in the auction exceeded market expectations, meaning weaker-than-expected demand.
Bottom line, the tail is a measure of unanticipated demand shifts for a Treasury issue before the auction. And the larger the tail, the worse the auction.
Put it this way, if we see a tail in the 4, 5, or 6bp range, this would be considered disastrous in the bond world and mean things are breaking in the US Treasury world.
OK, so now we know that a low BTC could be a red flag, an underbid auction can be cause for some concern, and a big tail is a big no-no, what exactly does it mean when a Treasury auction fails?
😵Total Fail
Going back to the Bid to Cover ratio, you may have been wondering what happens if the US Treasury holds an auction for a security and they receive fewer bids than the face value of the securities they are seeking to sell.
This would mean the BTC falls below 1, and the Treasury failed to raise as much money as they expected.
In the bond world, this is considered a failed auction, and it would be nothing short of catastrophic for the US Treasury.
So you may ask, in regards to Jurrien’s Tweet above, are we headed in that direction? With dwindling demand for USTs and active selling from Japan and China, is there a possibility of a failed auction on the horizon?
Why yes. Yes there is. But there are a couple of fixes to prevent this before it happens. At least in the short term.
See, right now, US commercial banks are still flush with capital. We know this because the Fed is receiving over $2.3T of reverse repo purchases daily in the repo window. This is extra cash that these banks sell to the Fed overnight to be paid interest.
If you haven’t read it yet, I wrote a whole newsletter about the repo and reverse repo market. You can find it here.
In any case, they are holding all this cash for a number of reasons, one being that they have to maintain a certain amount of cash on their balance sheet to meet liquidity ratios and leverage limits per the Fed, aka, the Supplementary Leverage Ratio (SLR).
So, the first fix is the Fed could adjust the SLR requirements for commercial banks to let them buy more Treasury bonds in lieu of holding cash or cash-like instruments. Secondly, the Treasury could pivot and start issuing more short term notes and fewer bonds. Reverse repo money could then be used in the auctions instead of just the Fed repo window.
Either way, the Fed and Treasury have a couple of options to prevent an auction meltdown just yet.
But once that $2.3T runs out, all bets are off.
💰USTs vs. Hard Money
I’ve been saying it for a while now. Even though risk assets and hard monies like gold, silver, and Bitcoin have been taking it on the chin with Fed tightening policy and the contraction of the money supply, these are safe places for long term capital preservation.
I would not pile into any one of these hard monies all at once. I also would not have 100% of my investments in any one of them. But I would start buying some at these levels if I had none yet.
To be clear, this is not for a trade for me.
This is for a long term investment and preservation of capital in the likely event that we see a major pivot by the Fed back to quantitative easing at some point next year or 2024.
That, and the highly likely long-term event that the UST is fully unseated as the global reserve currency, and the USD suffers for it.
In the meantime, I’ll be watching these Treasury auctions closely for clues of a pending liquidity crisis.
Before we go, I wanted to share something with you.
The team over at The Investor’s Podcast Network has been fantastic to me and I’d like to reciprocate by sharing their newsletter with you. If you don’t know TIP, they have an awesome show called We Study Billionaires, and I love hearing them chat with some of the world’s best investors, like Ray Dalio, Joel Greenblatt, Howard Marks, and others. In their words, with 100+ million downloads, they make podcasts by investors, for investors.
Using this intelligence, they’re now joining the newsletter space. You can read The Investor’s Podcast Network’s full daily commentary and expert insights in the We Study Markets newsletter.
It’s a great way to start your investing day! Click here to sign up (for free) today.
That’s it. I hope you feel a little bit smarter knowing about US Treasury auctions and how to read the tea leaves of outcomes in them.
Before leaving, feel free to respond to this newsletter with questions or future topics of interest. And if you want daily financial insights and commentary, you can always find me on Twitter!
Thanks again and talk soon!
✌️James