

✌️ Welcome to the latest issue of The Informationist, the newsletter that makes you smarter in just a few minutes each week.
🙌 The Informationist takes one current event or complicated concept and simplifies it for you in bullet points and easy to understand text.
🧠 Sound smart? Feed your brain with weekly issues sent directly to your inbox here
Today’s Bullets:
- What’s a Standard Deviation?
- What’s a Z-Score?
- How Do Traders Use Z-Scores?
- What’s an MVRV Z-Score for BTC?
Inspirational Tweet:
#MVRV Z-Score is a standard deviation that pulls out the extremes of Bitcoin price and realized value. The higher Z-score = more overvaluation, vice versa.
The Z-score broke down this week from this support since May 2020, but not yet in historical "undervalued" zone yet. pic.twitter.com/vVXcRC0NwI
— venturefoundΞr (@venturefounder) May 15, 2022
VentureFounder makes an interesting observation here about Bitcoin and its market value relative to its realized value, and using a z-score calculation, he concludes that the current price of BTC is low but not at historical undervalued levels.
If this is gibberish to you, don’t fret, we’re going to break it all down below.
🐧 What is a Standard Deviation?
To get to the z-score, we must first understand what a standard deviation is, because this is the basis for the underlying calculation. Basically, standard deviation measures the amount of variation in a dataset or set of values. You can use standard deviation to measure variances in anything, really.
For instance, say you take a trip to Antarctica and come across a colony of adult Emperor penguins. Thousands and thousands of them all clustered together, and almost all of them are relatively the same size at about 4 feet tall. But you notice a few of them seem to be shorter, some taller, and some much shorter or much taller than the rest. And right there you can see the variances of heights of Emperor penguins. Your data set (the colony in front of you) can be added up and averaged and then the likelihood of of a certain variance (difference in heights) can be calculated, the standard deviation.
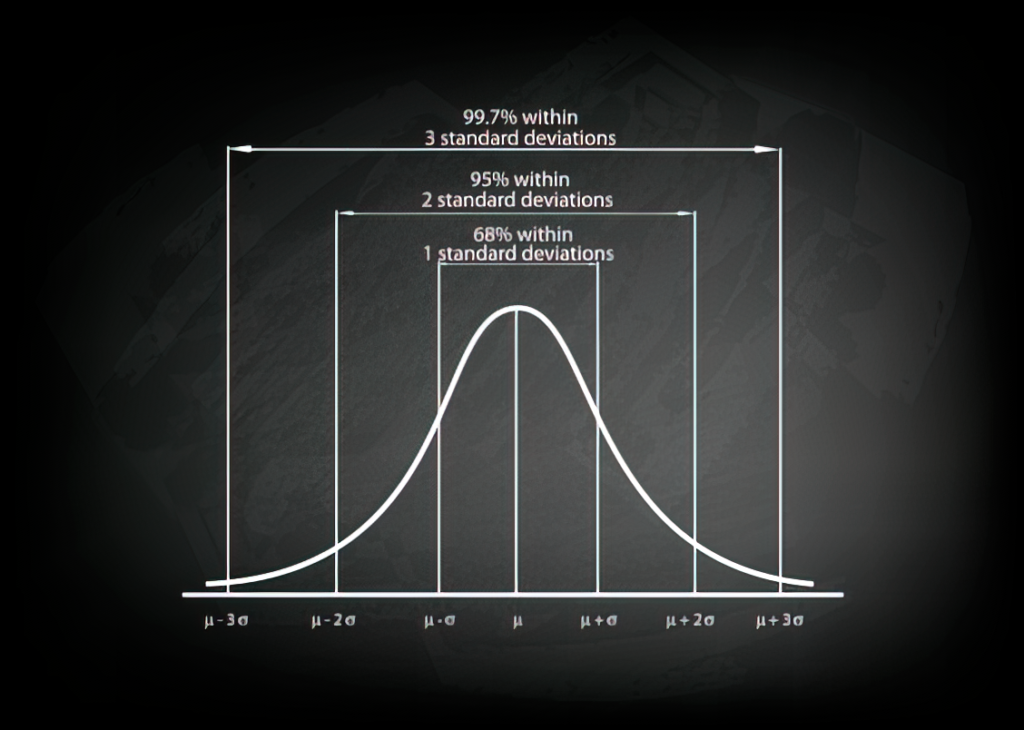
After lots of counting and measuring, you calculate that the average height is 45 inches tall. Furthermore, about 68% of the penguins are between 42 and 48 inches tall (one standard deviation of +/- three inches), 95% are between 39 and 51 inches (two standard deviations), and over 99.7% are between 36 and 54 inches tall (three standard deviations). Just a handful of penguins are shorter than 36 inches or taller than 54 inches.
This is known as the Empirical Rule (no relation to Emperor Penguins 😉) which states that 99.7% of values observed within a normal distribution lie within 3 standard deviations of the mean.
In other words, 68% of the data falls within one standard deviation, 95% percent within two standard deviations, and 99.7% within three standard deviations from the average or mean.
So, in our penguin example above:
- The average is 45 inches tall (the line at the center of the graph)
- 1 standard deviation would be within 3 inches of 45 (42 to 48 inches), and 68% of all penguins would be within this range
- 2 standard deviations would be within 6 inches of 45 (39 to 51 inches), and 95% of all penguins would be within this range
- 3 standard deviations would be within 9 inches of 45 (36 to 54 inches), and 99.7% of all penguins would be within this range
- and any penguin shorter or taller than this range is a true outlier and more than 3 standard deviations, or three sigmas, of the mean
Incidentally, I made all these heights up for ease of example and none of them are actual heights of real penguins. So, please don’t go quoting heights of penguins from this post at your next cocktail party or job interview. ✌️
Anyway, on to z-scores…
🅩 What’s a Z-Score?
A z-score is just the number of standard deviations a value is from the mean, positive or negative.
In other words, if a value has a z-score of 0, then that the data point’s value is exactly the same as the average value. A z-score of 1.0 would mean the value is one standard deviation from the mean, 2.0 is two standard deviations, etc., and a positive z-score shows the value is above the mean, a negative z-score shows it is below the mean.
Using the penguin example, say you choose a penguin and want to assign a z-score to it’s height. If the penguin is 49.5 inches tall, then its z-score would be +1.5 (because it is 4.5 inches, or 1.5 standard deviations of 3 inches from the average). And a penguin that is 39 inches tall would have a z-score of -2, because it is two standard deviations below the mean of 45.
📈 How Do Traders Use Z-Scores?
Traders will use z-scores in a host of different ways, but usually the scores have to do with the volatility of a stock and the standard deviation of the stock’s price over a period of time. A favorite of technical analysts is called the Bollinger Bands.
Choosing a time period, then using a simple moving average of a stock’s price in that period, traders will plot trend lines above and below that moving average that are typically two standard deviations of the average price above and below. When a stock has a z-score that is either approaching or has crossed through these Bollinger Bands, then that is taken as an indicator that the stock is either overbought (above the Band) or oversold (below the Band). The z-score tells the trader exactly how much it is above or below the mean.
So, if the trader is using a two standard deviation Bollinger Band channel, then a stock with a z-score of +2.1 would be overbought, and if the stock’s z-score was -2.1, it would be seen as oversold and a buying opportunity.
Then, using other indicators, such as the Relative Strength Index (RSI), paired with the Bollinger Bands, they confirm the overbought or oversold indicators, and this may give them enough confidence to act on a trade.
Not as difficult as you thought, right?
⏰ What’s an MVRV Z-Score for BTC?
Of course, we can use Bollinger Bands for technical analysis on Bitcoin (BTC), and many traders do, but one metric that a number of BTC traders and investors like to look at is called the market value – realized value (MVRV) Z-score.
This analysis uses three metrics to determine whether BTC is overvalued or undervalued in the market:
- Market value (MV), just like market cap in stock markets (share price x number of outstanding shares), is the current price of Bitcoin multiplied by the number of coins in circulation
- Realized value (RV) is the average price of each Bitcoin when it was last moved (sent from one wallet to another) multiplied by the total number of coins in circulation
- and Z-score, the standard deviation of the market value and realized values
By taking the ratio of MV to RV and plotting the z-scores, traders can assess whether BTC is overbought or oversold, according to historical values. The point here is that the z-score removes extremes from the simple market value to realized value ratio line and helps identify those overbought and oversold values.
Like VentureFounder shows in his post above, BTC currently is nearing oversold territory, yet using the z-scores, it is has not quite entered the green band at the bottom of the chart, which denotes the oversold region. But he and others are certainly watching that chart closely as a place to trade or add to their BTC positions opportunistically.
That’s it. I hope you feel a little bit smarter knowing about standard deviations, z-scores, and how traders use them to assess the price action of the securities they are trading.
As always, feel free to respond to this newsletter with questions or future topics of interest!
✌️Talk soon,
James