

✌️ Welcome to the latest issue of The Informationist, the newsletter that makes you smarter in just a few minutes each week.
🙌 The Informationist takes one current event or complicated concept and simplifies it for you in bullet points and easy to understand text.
🧠 Sound smart? Feed your brain with weekly issues sent directly to your inbox here
Today’s Bullets:
- The government as a business
- What’s a debt spiral?
- What’s the situation in the US?
- How can you protect yourself?
Inspirational Tweet:
The US debt spiral, a thread…
US Tax revenue $4T
minus: Entitlements $2.8T
minus: Defense $0.8T
leaves: $0.4TAnnual interest exp is $400B (at historic low coupons)
Interest coverage ratio is 1X (solid CCC ratio for corps)
/2
— FOSS – Lehman CDS at 9bps in '06, 🇨🇦 now at 33 (@FossGregfoss) August 17, 2022
Brilliant thread here by Greg Foss, laying out the challenge the US faces with the sheer amount of its outstanding debt. That said, some of the references here may be a bit foreign for some and confusing for others.
But there’s gold in this thread, so grab a cup of coffee, settle in, and let’s unpack it for everyone, shall we?
🏛 The government as a business
Before we get into any specifics, let’s first walk through the basics of how a government operates financially. And while it’s an extraordinarily complex beast of an operation, it can be boiled down into some pretty simple parts that mirror a typical company.
Just like any business, a government has revenues and expenses and often borrows money for various reasons in the form of debt.
Note that this is different from the debt the Fed has on its balance sheet because of quantitative easing. That’s basically debt that the government has issued that it then bought back from investors and now holds itself.
Sounds absurd, doesn’t it? Because it is.
Anyway, I recently wrote a whole newsletter about the Fed and quantitative easing, which you can find here.
Back to the point.
About 95% of US government revenues come in the form of simple taxes: individual and corporate income taxes (including capital gains taxes), payroll taxes, and excise taxes. The other 5% of revenues come from estate and gift taxes, customs duties, earnings at the Fed, and other fees, penalties, and charges.
Just like a business, then, there must be enough revenue to cover all expenses for it to keep operating. The budget. And in the business of running a country, taxes are supposed to cover all of the government expenses: infrastructure, defense spending, entitlements, etc., and then interest payments on its debt.
Of course, we live in the land of excess, so…
Here’s what the US federal budget looked like it 2020:
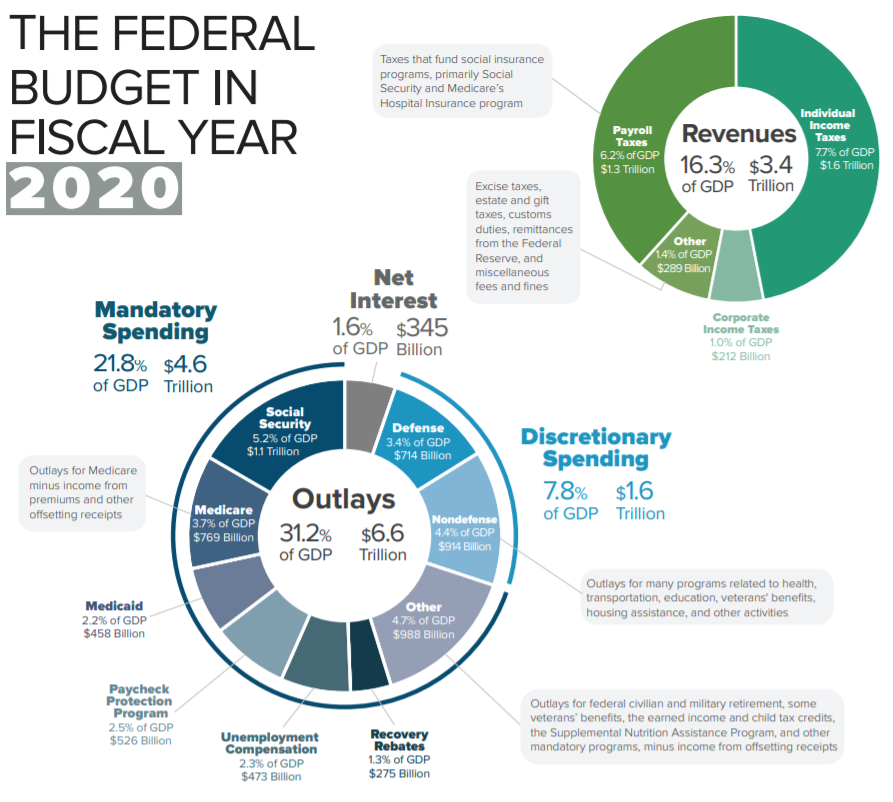
Yep. We spend far more than we make, as the US is perpetually operating in a deficit.
🌀 What’s a debt spiral?
If a government is operating in a deficit, it can either cut expenses (ha!), generate more income by stimulating GDP (think war), or raise taxes. Problem is, cutting expenses costs votes; war can lead to future productivity damage and/or losses, especially if it is counter attacked at home; higher taxes can weigh on companies and hurt their ability to grow and in turn hurt the country’s GDP, which then leads to lower tax revenues.
The easiest thing to do? Just issue more debt to cover the budget. Problem solved, right?
Right?
Well, we know what happens to a company that issues too much debt and winds up unable to pay the interest on it.
Exactly.
It becomes distressed, and if it cannot fix its budget problem, it eventually goes bankrupt. The difference here is countries are given far more leeway in the amount of debt they can issue before investors begin to raise an eyebrow.
We often talk about debt to GDP as an indication of a country’s financial health. But perhaps more importantly, we can look at the country’s budget, its actual revenues and expenses. From this, we can calculate an interest coverage ratio:
(Tax Revenues – Entitlements – Defense) / Interest Expense
Please note: This calculation is purposefully simplified, as the remaining budgetary items can swing considerably from year to year with legislation.
Bottom line, if this number is lower than 1 to 1 (i.e., there are more interest expenses than revenues left over to pay them) then a country must borrow even more money by issuing more debt. This only raises that interest expense payment, which makes the ratio even worse.
Think of it like this: You run up the balance on a credit card. The monthly payments are more than you have after paying for mandatory things like mortgage, car loans, and food. So, you take out another credit card to pay for some of these things. But your credit score is worse and the interest rate on this new card is higher. So, now the monthly payments are even higher. And you have borrowed more. To make those payments, you have to open another credit card…and so on…you are trapped.
It’s no different for a country perpetually operating in a deficit.
more debt → higher interest rates → higher deficits → more debt
As it worsens, investors lose confidence in the country and demand higher rates for the country’s bonds, only worsening the situation.
The dreaded debt spiral:
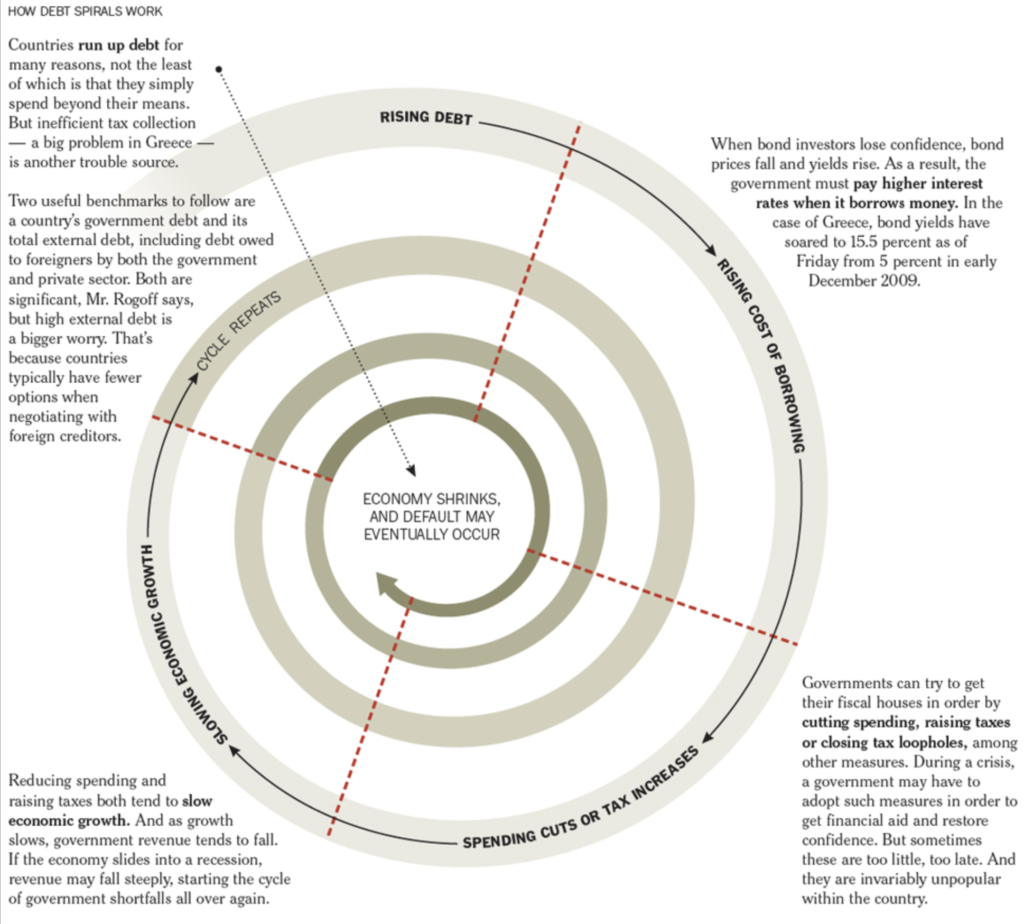
Graphic by Guilbert Gates for The New York Times
🇺🇸 What’s the situation in the US?
Keeping it simple, let’s take a look at the US budget situation. As you see in the chart from 2020 above, it wasn’t looking all that great before. But now that the US has issued massive amounts of debt the last few years, it’s even worse today.
Let’s take a look at a snapshot from the debt clock.
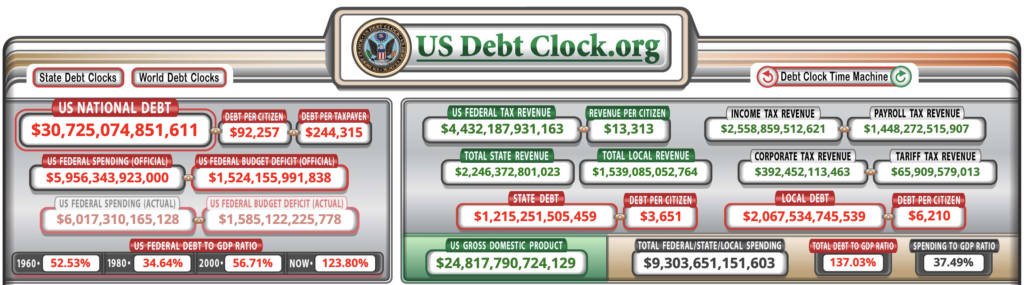
You can see here, the current running total of US federal debt is $30.7T, and US GDP is $24.8T. Including all federal, state, and local debt, the current debt to GDP ratio is 1.37 or 137%.
Not great, at first glance.
But let’s dig deeper. How’s the interest coverage ratio looking?
Though the debt clock shows that the US currently estimates $4.4T in tax revenues, the US Congressional Budget Office counts an additional $400B in “other taxes” and, therefore, estimates total tax revenues to be $4.8T in 2022. Even if we give the CBO the benefit of the doubt, it still doesn’t look so good.
Why?
entitlement spending + interest on debt > revenues
Taking the same CBO report, we can see that mandatory expenses add up to a total of $3.7T for 2022. This includes all entitlements and outlays that are signed into legislation and are considered absolute obligations. Then we add in the estimated $800B of defense spending, and we get a total of $4.5T in expenses in 2022.
So, our coverage ratio:
$4.8T taxes – $3.7T entitlements – $800B defense = $300B leftover for interest expense
Problem is, the US is currently running a tab of $400B on interest annually. I mean, you don’t have to be great at math to see that 300B minus 400B = negative 100B
So our interest coverage ratio is currently .75x!
And here’s where the math gets really ugly.
See, with rising interest rates, as current debt matures and needs to be replaced, the additional interest cost adds up rapidly. As Greg points out in his thread above, even keeping all other spending constant, if we replace that $30T of debt at 3.2%, the annual interest expense becomes $1T.
That’s $600B more than currently and pushes the interest coverage ratio all the way down to .3. Forget distressed, that’s downright bankrupt. If the bonds were corporates, they would be trading at a few cents on the dollar at best and only because there would be claims on assets to offset the risk.
But wait. There’s more.
As Greg also points out, this is before reduced tax revenues due to lower capital gains as the market sells off in this recession. And I’ll add, fewer corporate taxes with earnings lower than the above estimates.
In order to avoid this immediate problem, the Fed will likely pivot by lowering rates and resuming quantitative easing. They simply kick the debt can down the road. Inflation resumes, they must raise rates to tame it, and then borrow at the higher rates to cover the budget deficit. A vicious circle.
The math remains simple but ominous.
Even the CBO agrees, as you see in the charts below. Debt to GDP and the deficit from interest payments both inevitably grow from here.
Projected debt to GDP:
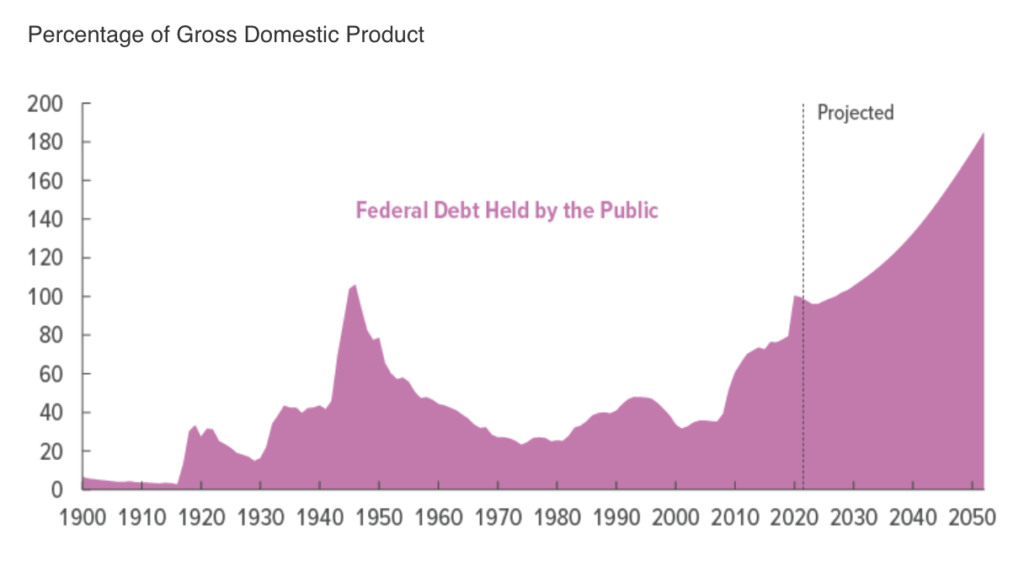
Congressional Budget Office
And the projected deficit, even with their generous baseline assumptions:
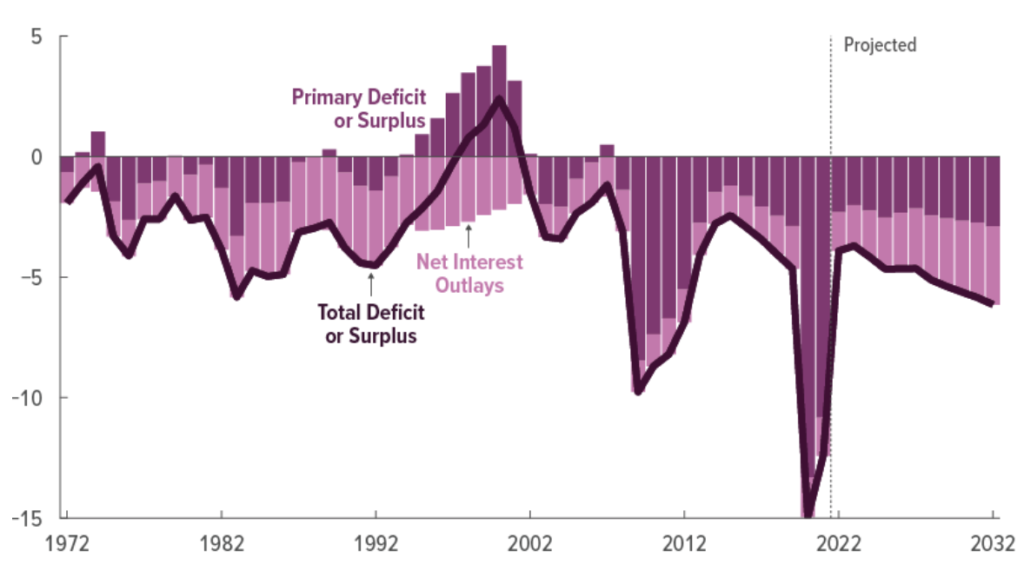
The only other choice is to let inflation run hot, higher than the stated 2% target, in the hopes to raise GDP and monetize the debt. In other words, use cheaper dollars to pay off old debts. Still only a short term solution, though, as investors will eventually demand higher Treasury rates in order to be compensated for being paid back in cheaper dollars.
There really is no way out. It’s a debt trap that leads to a debt spiral, and in my opinion, we’re already in it.
🛡 How can you protect yourself?
You’ve heard me say it before, and I will reiterate it here. Though every investor is unique, and obviously requires specific advice from a personal advisor, I think it is prudent to have a portion of an investment portfolio allocated to hard assets like gold and silver, and also a small percentage in Bitcoin.
As we continue down this path of fiat manipulation and QE infinity, kicking the debt can down the road, there is simply no way out for sovereigns. Whether it is in 10 years or 50, every single fiat based sovereign currency will eventually collapse under the weight of their own debts.
When this happens, those who own hard money like gold, silver, and Bitcoin will have protection against their own currency hyper-inflating and being reset.
Some of you have seen this thread before, but for those who haven’t, the scenario is all laid out for you right here:
As a risk trader, I’m always concerned about 'Tail Risks'.
And #Bitcoin hedges against the biggest tail risk we’ve ever faced in the history of the modern financial world:
An all out collapse of fiat currencies.
How? Let’s break it down nice and easy here 👇🧵
— James Lavish (@jameslavish) February 15, 2022
The bottom line, and what we have learned that is most important for each of us to understand after the last two years, is that it is absolutely inevitable.
Fiat is backed by nothing.
Our global financial system is built on debt and borrowing.
Eventually these debts get too big, even for the United States.
The chickens will someday have to roost.
That’s it. A little longer today, but I hope you feel a bit smarter learning about debt spirals and specifically the situation here in the United States.
Before leaving, feel free to respond to this newsletter with questions or future topics of interest. And if you want daily financial insights and commentary, you can always find me on Twitter!
✌️Talk soon,
James