

✌️ Welcome to the latest issue of The Informationist, the newsletter that makes you smarter in just a few minutes each week.
🙌 The Informationist takes one current event or complicated concept and simplifies it for you in bullet points and easy to understand text.
🧠 Sound smart? Feed your brain with weekly issues sent directly to your inbox here
Today’s Bullets:
- What is Narrow Money?
- What is Broad Money?
- Digging into M2
- Does M2 Predict (Read: Cause) Inflation?
Inspirational Tweet:
Today's high inflation stems from the extraordinary post-COVID federal government deficits & the Fed's monetisation of that debt, which saw extreme money supply growth in 2020 and 2021. Today the script has flipped, with M2 now seeing one of its sharpest EVER decelerations. pic.twitter.com/DTEtRXqLt0
— Steven Anastasiou (@steveanastasiou) November 23, 2022
With seemingly the entire world focused on inflation and the causes of it, there may be an incredibly simple answer to all the questions about its causes and origins. As Steven Anastasiou points out here, we are seeing a severe downturn in M2 expansion this year, and this may play a big part in taming inflation soon.
But what exactly is M2, and what does it have to do with inflation?
Let’s dig into money nice and easy and get answers to these questions today!
🤏 What is Narrow Money?
To understand money and supply, we first need to understand the different types of money and their definitions. We will focus on US definitions and US Dollar money supply for today.
At the most restrictive end of the money supply measures, we have what is called narrow money, or M0 (‘em-zero’). This includes only currency in circulation and cash kept in reserve by banks. Hence, M0 is often referred to as the monetary base.
Moving up one notch, we have what is known as M1.
M1 includes all of M0 plus demand deposits, as well as any outstanding traveler’s checks. Demand deposits are simply liquid deposits in bank accounts that can be withdrawn by a customer at any time, i.e., customer checking and immediately accessible (demand deposit) savings accounts.
Wait, you may say, do banks have all this cash in the safe? Ready for withdrawal?
The answer is no. This money is accounted for digitally in the fractional reserve system. If you want to understand that better, we covered fractional reserve banking in a recent Informationist Newsletter, and you can find out more about that here.
TL;DR: Banks don’t hold all your cash in their vaults. They use risk analysis to determine the velocity of capital and cash within their system and estimate how much needs to be available at various branches, etc. in absence of a run at the bank.
The rest is just 0s and 1s on a digital ledger that they keep.
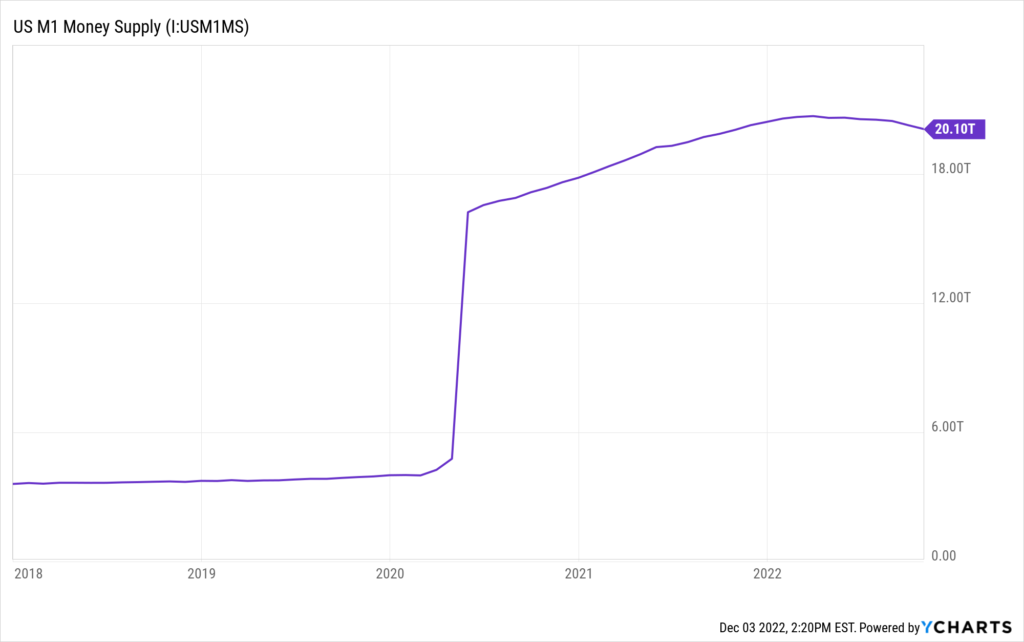
In any case, M1 includes this digital cash that could be withdrawn (including those traveler’s checks), but stops there. Hence, M1 is often referred to as narrow money.
Here’s how much M1 is out there in US Dollars:
🖖 What is Broad Money?
Moving our scope out a little bit, broad money includes all of M1 and more and can be defined as M2, and here in US, M3.
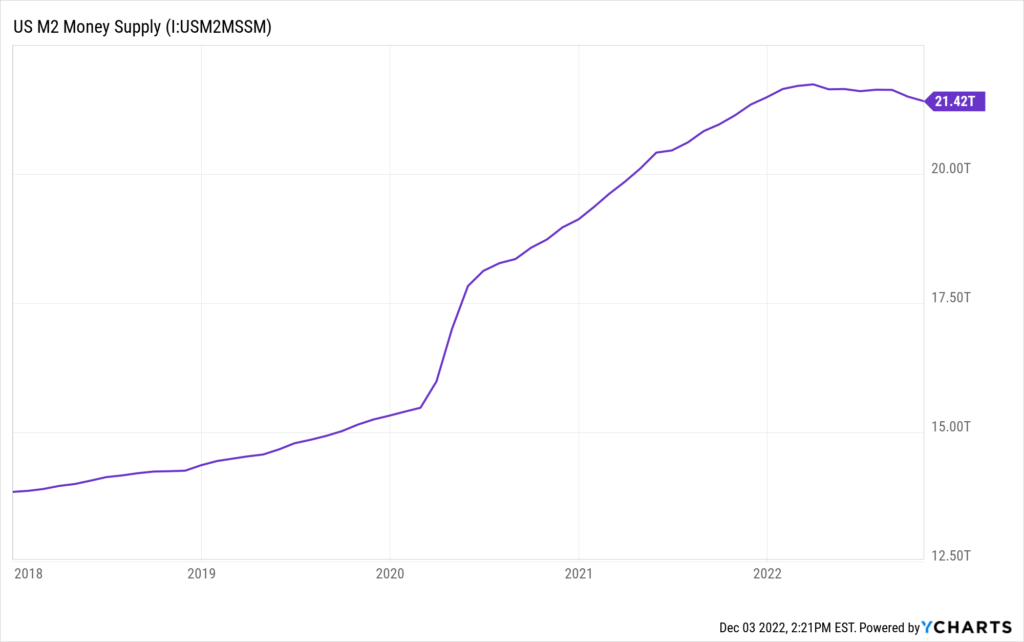
M2 includes all of M1 plus money market savings deposits, small time-restricted deposits under $100,000, and shares of money market mutual funds. In other words, M2 includes all money that is held in cash equivalent accounts, liquid and illiquid.
Expanding to M2, here is the amount in USD out there today:
Expanding the scope further, we get to M3, or what is often referred to as near money. This includes all of M2 plus larger time deposits, institutional money market holdings, short-term repurchase agreements (i.e., repos), and other large liquid assets.
M3, or near money, is not as liquid as M1 or M2, and is considered a reflection of institutional-level holdings of money. Because these are less liquid forms of money, M2 and M3 are more of a measure of money being held as a store-of-value rather than a medium of exchange.
The Federal Reserve discontinued publishing estimates of M3 supply as of 2006.
Interesting, yes. The claim here is that the cost to research and compile M3 as a data point had grown to the point where it outweighed the benefit of knowing the number.
Uh huh. 🙄
🧐 Digging into M2
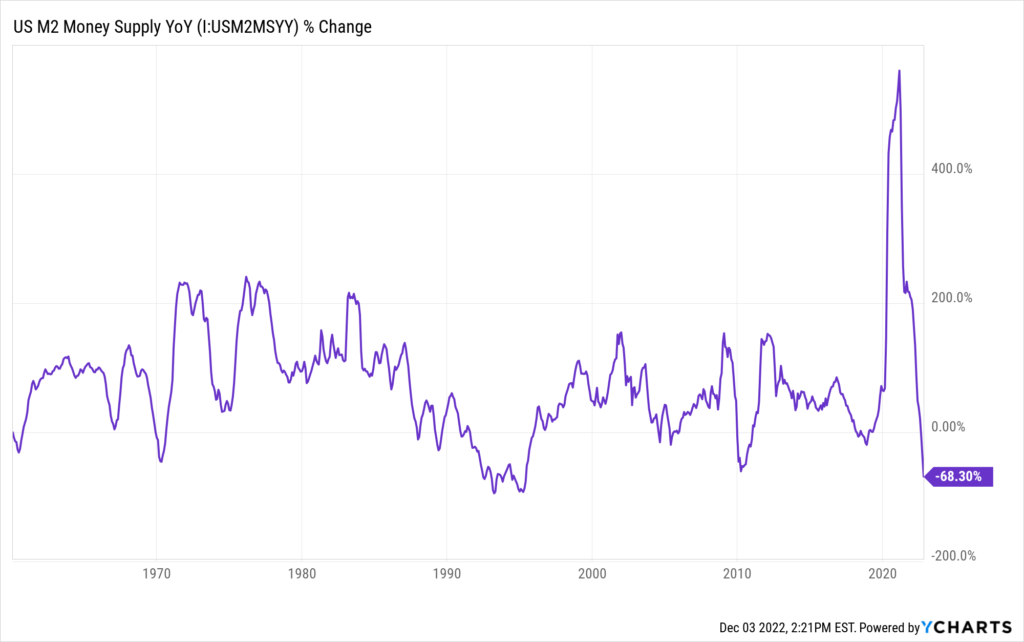
Getting back to what’s been going on with M2 recently, in his post above, Anastasiou points out the severe contraction of M2 supply growth this year.
Here is a full chart showing the year over year expansion and contraction of M2:
But how exactly is this happening, and what does it mean?
It’s highly likely that you’ve heard and read quite a bit about Quantitative Easing (QE) and Quantitative Tightening (QT) in the last two years.
As a quick refresher, QE is when the Fed and Treasury work together to add liquidity to the markets. The way they do this is the Treasury presses a button that creates new balances at the Fed, then the Fed goes into the open market and buys various assets, such as US Treasuries and mortgage-backed securities (MBS). With this additional liquidity, the government has essentially created new money entering the system that was not there before.
The world-famous Powell money printing meme:

Of course, The Fed and Treasury can work to remove liquidity and decrease the money supply as well, using QT.
The way they do this is by first letting some of those Treasuries or MBS mature without replacing them. Next, they can enter the market and physically sell the Treasuries or MBS, thereby removing some of the available cash from the system.
Pressing another button, and that cash disappears.
Question is, what are the effects of all this expansion and contraction, and does it actually impact inflation?
🤓 Does M2 Predict (Read: Cause) Inflation?
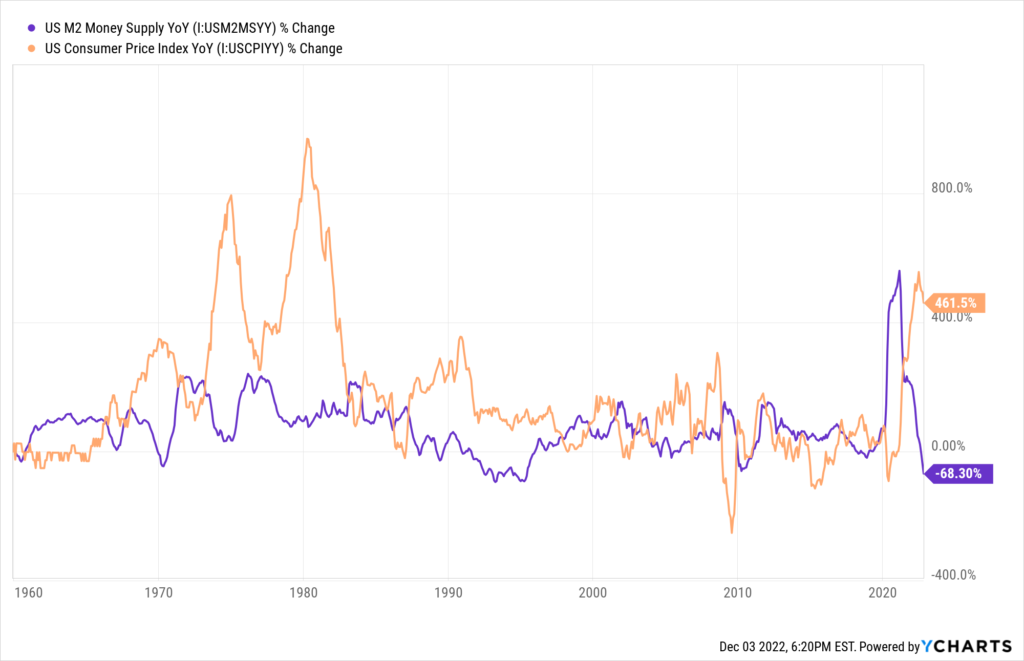
As we can see in the above charts, M2 rapidly increases starting in March, 2020. Then, surprise, surprise, about one year later, US consumer prices began to ascend rapidly.
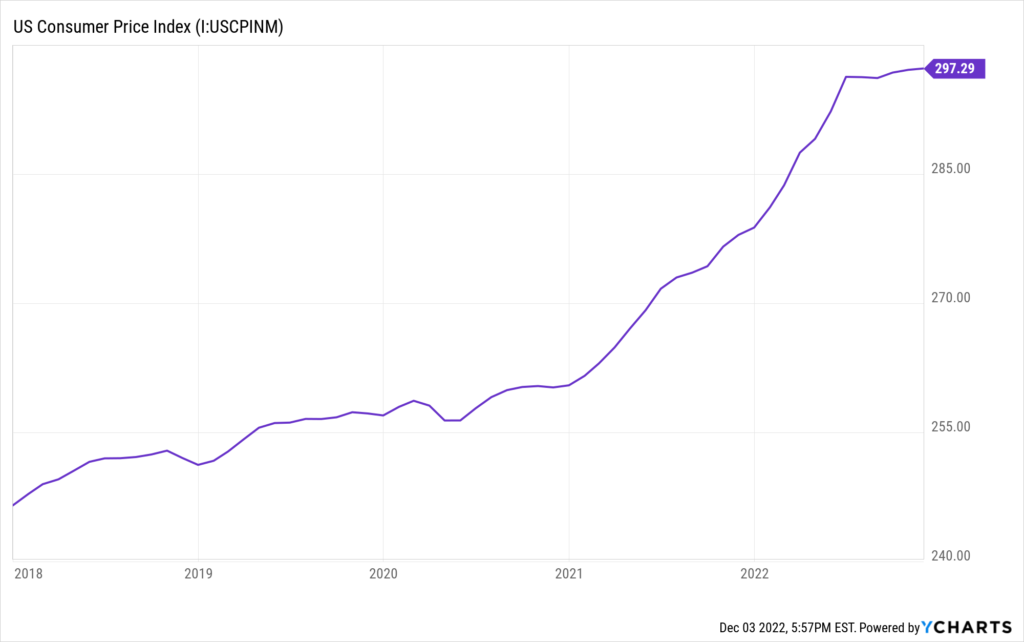
We should note that some of this price acceleration was caused by supply chain issues as well as stimulus checks given directly to consumers. These no doubt exacerbated the pricing pressures upwards.
We can then see the pressures level out in the middle of 2022.
Interestingly, this is soon after the Fed stopped their QE program and halted their purchases of securities on the open market.
But as we showed above, M2 has begun to retract rapidly this year. The implications on inflation are obvious, but most economists study the year to year correlations, which can be noisy:
Yet, Lyn Alden pointed out in one of her recent newsletters (highly recommended, BTW), that we should rather look at a rolling 5-year per capita broad money against CPI measure to mute that annual noise and see the clear correlation. You may also notice below how CPI reactions often lag the expansion of broad money.
Adding some pro-forma data onto Lyn’s graph, the direction that this is going appears clear:
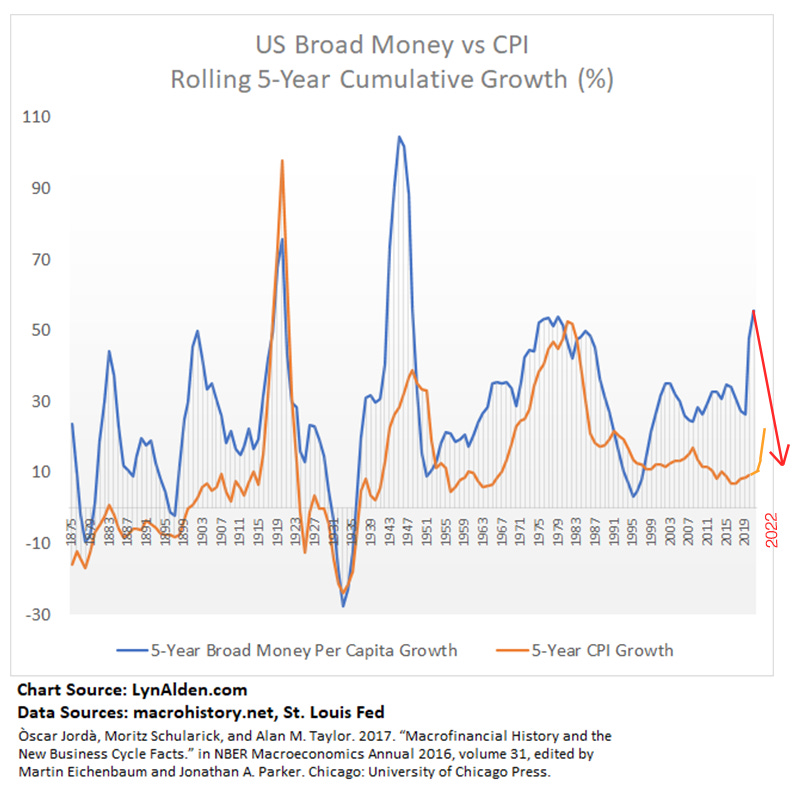
And so while it still may take a number of months for inflation to settle down, with the extreme reduction in M2 and broad money supply, I fully expect inflation to follow soon.
That said, with such drastic increases in Fed Funds and borrowing rates, we now face a serious possibility that the Fed over-tightens, removes too much liquidity, and sends the economy into a severe recession. In this case, it’s back to the money printer and possibly QE-infinity.
And then, all bets for taming inflation are completely off.
As for me, I’ll be paying attention to the money.
That’s it. I hope you feel a little bit smarter knowing about M2, the various measures of money supply, and how they impact inflation.
Before leaving, feel free to respond to this newsletter with questions or future topics of interest. And if you want daily financial insights and commentary, you can always find me on Twitter!
✌️Talk soon,
James