

When I started my investment journey, I followed a path walked by many a retail investor. I read a heap of the recommended books on investing, from Graham to Greenblatt to Pabrai to Lynch. I listened to countless podcasts and watched endless hours of YouTube. I had done the research and was determined to follow in the footsteps of the greats like Warren Buffett. I wanted to be a value investor. I wanted to find good stocks and I wanted to buy them at cheap prices. Easy right?
I learned how to value companies using the typical discount cash flow models, I learned how to read a financial report and analyse balance sheets, income statements and cash-flow statements. With all this theory I was energised, excited, pumped, ready and armed to go and find my first diamond in the rough.
I quickly and abruptly hit a hurdle. There weren’t any diamonds to find. None. Perhaps this is a little hyperbolic, but I looked at a universe of ASX stocks, used screeners to try and find good companies at valuations that aligned with my investment thesis that would provide my required-rate-of-return for rewarding my efforts. There was quite literally less than a handful of companies that met my evaluation metrics, let alone finding them cheap enough to factor in the infamous “margin of safety”.
This was a little deflating at the time, I wasn’t naïve enough to think that I would find one straight away, I knew from what I had read that investing is a game of patience, so I exercised this patience. I watched the markets for the next 12mths. I analysed hundreds of companies, made a list of the companies I wanted to own and I did the math to determine at what price I wanted to pay. The problem was, it was obvious everyone else thought the same about these companies, they liked them too. The problem was they were willing to pay a lot more for them than I was. And I mean a lot more. These prices weren’t even close to my valuations. Not even in the same ballpark.
Fast forward to March of 2020 and we had a sharp sell-off. 30–40% downturn in around 30days. I got super excited (pandemic and global catastrophe aside), here was finally my chance to deploy some of this cash I had accumulated which was sitting in the bank doing absolutely nothing for me. Out of the universe of stocks I track within my automated, price-fed spreadsheets, I found 3 stocks I wanted to buy. 3!!….. that’s it. I couldn’t believe that after the most severe market correction in over a decade it presented me with only 3 stocks that met my price targets. Don’t get me wrong, I did very well in the recovery from those 3 stocks, but I was gob-smacked at only being presented with 3 stocks. I was expecting to experience the feelings akin to being a kid in a toy store, having too many toys to choose from. I was expecting to have to deal with the agonizing prospects of deciding which of my darling stocks would be coming home and which I would have to leave behind. The 3 stocks that met my criteria, while good stocks with good balance sheets and good fundamentals, didn’t rank overly high on my wish-list. I naturally started to question my valuation techniques, I re-read some of the books, checked my formulas, reassessed my expectations and I still come up short.
“Something isn’t right here”, I said to myself. And this is where my knowledge journey really began.
Like a red rag to a bull, I was determined to figure out what the hell was going on. I thought I had a good understanding of the way markets worked, the supply/demand flows, price discovery and the workings of the infamous Manic-Mr-Market. The more I started to deeply learn about the plumbing underpinning the system, the more I discovered really how little I did know know. A lot of what I thought I knew was actually only the “assumed way” it was supposed to work, but in reality, this is far from the truth.
In this article I hope to demonstrate just some of the ways by which we have found ourselves in the giant asset bubbles we are experiencing in 2021. This article will focus mainly on the stock market, and like many of my articles will focus more on the US purely because the data is easier to find, however put trust that the same thesis applies to just about every stock market in the world today.
I will focus my attention on 3 key principles effecting the stock market today which are demonstrative of the situation we know face. Those 3 topics are:
- The Risk-Free-Rate-Of-Return and how it is used in asset prices valuations
- The search for yield with a focus on over indebted pension funds.
- Passive Flows — ETF’s, Index Funds, 401k’s and retail investors
It is helpful if you have a good understanding of bonds and yields to be able to fully grasp the concepts in this article. Please read through my article on bonds for a comprehensive and easy to understand introduction.
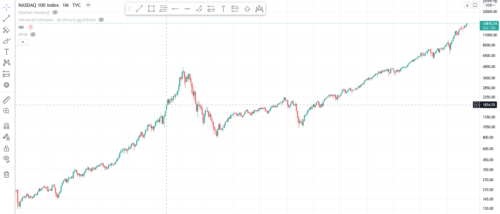
Nasdaq
1. The Risk-Free-Rate-Of-Return
In my article on bonds we cover Quantitative Easing (QE) and how the Fed uses this QE program to artificially supress yields. We also looked at how the US treasury is considered the “Risk-Free-Rate-Of-Return” and we highlighted how the risk-free-rate-of-return underpins a lot of global finance including the rest of the bond market. By artificially pinning rates low, we are suppressing the natural price discovery that would occur within a free-and-open market. A free and open market would naturally determine what the real cost of capital would be. That is, what would be the natural cost to borrow currency for economic growth.
It turns out, that when we artificially suppress treasury yields, not only are we artificially supressing the yields we can achieve in the bond market, we are also affecting asset prices of other markets like stocks and real estate. Real estate is easy to understand because it makes our cost of borrowing cheaper, making our repayments cheaper, making our serviceability of debt more affordable. People may get an investment property or buy a bigger house. This excess demand in the real-estate market driven by the lower cost of capital, results in increases in house prices and creates a real estate asset bubble. But what isn’t as easy to identify is how low interest rates can blow bubbles in stock prices.
Many retail investors don’t fully comprehend or understand the concept of stock valuations. Many amateur investors simply buy stocks because they “like the company” or they think “the price will go up”, or “the price was $61 last week, its only $59 today, it’ll come back”. Little thought is given to business cycles, balance sheets, future growth potential or competitive moats. The professionals however are using valuation methods like discount cash flow models to evaluate how much the stock is trading for in relation to future expected returns. They are trying to determine if the stock is trading for a premium or a discount to its intrinsic value.
Discounted Cash Flow Models
Without going into full detail about discounted cash-flow models, we will cover that in future articles, we will look simply at an example of a discounted cash flow model and the variables that go into the model. The model is simply an equation you can use to determine, as highlighted above, if a stock is trading at a discount or at a premium to its intrinsic value. Intrinsic value can be subjective and is outside of the purview of this article, suffice to say for now it is a measure of what a company is worth, it accounts for things such as tangible and intangible assets, cash, inventories but also things like earnings potential, growth potential and future performance. In other words, what price should this company be valued at accounting for everything you would gain by buying it. Like most things, there are many ways to skin-a-cat when it comes to discounted cash flow modelling. There are myriad different approaches, methods and variation of formula for working out a company’s intrinsic value. These are easily found on the internet should you wish to get a deep understanding beyond this article, however we can say that there are a usually a few consistent variables that feature frequently. Namely, growth rate and discount rate.
One usually starts by determining the free cash flow, usually by looking at their most current financial report. You then must determine a growth rate to project what we expect the growth of these cash flows will be into the future. You then use a discount rate to determine what price you should pay for these future cash flows that will provide you a return on your investment. And here is where our old friend the Fed-manipulated-treasury-rate comes into play.
When investors want to compare apples with apples, they use the risk-free-rate-of-return as the base-level comparison for what they should pay for a stock. For example, if we are being generous and suggest for now thatthe risk-free-rate-of-return for a US treasury bond is 1%, we are suggesting that an investor can park their money in one of these bonds and earn 1% every year for little to no risk. If, however, we wanted to take on a little more risk and purchase stocks, we would expect a little higher return than 1% for our efforts, so we use the risk-free-rate-of-return as a comparison within our valuations.
Let’s use an example to try and illustrate this better. In this example I use a valuation method outlined in “The Warren Buffet Accounting Book — By Preston Pysh and Stig Broderson”. Out of respect for the authors intellectual property, I will not provide the specific formula, this book is sold at bargain price and is a highly recommended read for every investor.
This formula takes into consideration book value (which is a metric of the company’s tangible assets), dividend rate (how much the company is paying to shareholders annually), growth rate (how much we expect the company to grow over time), discount rate (as we have highlighted already) and a time period of ownership (I usually assume 10years).
Using this formula, I kept all variables the same except for the discount rate. The discount rates of 1%, 3%, 5%, 8% and 10% have been used to illustrate the effects that these varying levels will have on the stock valuation.
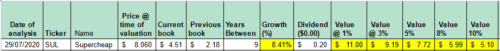
Figure 1. Discounted Cash Flow Model Example
In this example I chose an ASX stock called Super Retail Group (Ticker: SUL). I decided that I would pretend I was conducting this evaluation as of July 2020 (1year prior to writing) to be more illustrative for this example. So on the day of analysis the stock was trading at $8.06. Adding the book values from their financial report we determine growth rate experienced in the preceding years and I assume that this growth rate will continue into the future. We then factor in the latest dividend payout, assume this will also continue into the future and our spreadsheet and formula does the rest. We can see that I now have price targets for each of the discount rates mentioned earlier.
As discussed, investors will often run these models to get a comparative valuation against the risk-free-rate-of-return. We established that we would assume a current risk-free-rate-of-return of 1%. We can see that with a 1% discount rate applied to the DCF model , it says that if I were to purchase SUL for $11.00, I could expect to receive a 1% return year on year for the 10 years of ownership. The stock is currently trading at $8.06, based on the current price alone and the DCF valuation this looks like a cheap price for the stock. Being able to buy the stock at $8.06 means I am getting it at a discount to an expected return of 1%.
But, if 1% is my risk-free-rate, won’t I want a little more bang-for-my-buck for taking on more risk? After all, this is a retail store, they might go broke, I might lose all my money!! I run my model again, but this time I use 3% as my required rate of return and compare the results. $9.19. If I can buy the stock for less than $9.19, I can expect a better than 3% return year on year.. It might therefore still be considered cheap at today’s price of $8.06, I simply have to decide if the 3% return is worth the extra risk I am taking on, compared to what I can get risk-free from a treasury bond.
As I go higher up with my required discount-rate I can see that the current price starts to look less and less attractive. If I wanted to receive a 10% return year on year for my risk of owning this stock, I would have to buy this stock at a price below $5.10. In other words, if I require a 10% return, this stock is now looks overvalued.
We can now see in this example that the lower that the Fed-manipulated risk-free-rate-of-return is, the more attractive stocks start to look by way of comparison. To expand on this thought, if the Fed allowed rates to rise to what many believe would be the natural market equilibrium of anywhere between 4–6%, (let’s use 5% to make it easy), a 5% risk free rate of return would be the benchmark we would set ourselves to compare all other returns. Our stock SUL is already trading at a premium to our new risk-free-rate-of-return at $7.72 @ 5%. So why would we bother taking on the excess risk for less return? We wouldn’t. If the Fed allowed treasury yields to rise, massive stock revaluations would ensue, the market would realise they are overpaying compared to a risk-free-rate and an enormous sell-off would be started.
We saw in my article on bonds that the Fed can’t allow a stock market sell-off because it will cause massive liquidations to start, this will feedback upon itself. The same will happen to the bond market, a massive sell-off as people flood to the perceived safety of the USD. This will put further pressure on rates, feeding itself again even further. We are in a perpetual loop of doom.
The lower the rates, the cheaper stocks appear to people looking for a home and a potential return for their capital. This leads us into the next fuel for the fire that is the stock market asset bubble…..the search for yield.
2. The Search For Yield
Bonds and stocks both played a critical role in typical investment portfolios, especially those investment portfolios of hedge funds, money managers, family offices, pension funds and sovereign wealth funds. The 60/40 stock/bond portfolio was the textbook play for institutional players providing the perfect ratio of risk to reward. This balanced reward/risk ratio does require one key component…. achieving a decent yield on bonds.
As bond yields got squeezed and squeezed over the past 40 years, we got to a point where there was little reward at all for holding a bond. In fact, once we factor in inflation (see this article for a good understanding on inflation) we are guaranteed to lose money. Sounds like a good deal, right?
In the past few years, we have seen more and more institutions fleeing the traditional “safety” of bonds searching for yield, searching for an actual return on their capital. Where do they go looking? The stock market.
Side Note: How is there a bond market at all I hear you ask? Why would people waste their time on a negative yielding investment vehicle? Well, quite simply, some are mandated to do so. Yep, some commercial banks and funds such as pension funds are actually mandated to hold bonds…crazy hey? Plus, a lot of these funds are mandated by their own governance to maintain certain ratios of stock/bonds, they are also governed by what types of asset they can hold and what investment grades of the vehicles they can hold.
Let’s focus our attention specifically on pension funds, as they are a good case-study to explain how this “search for yield” is impacting upon stock valuations. Pension funds are, in simple terms, one big fund of liabilities. Funds such as those held by municipalities in the US have over-indebted pension liabilities. Meaning they have too many promises to pay their long-retired police officers, firefighters and public servants than they have capital available within the fund long term. It is understood that these pension funds require ~7–8% return on their capital to remain solvent. This wasn’t such a problem when they could get 5% on their bond portfolio. It becomes a whole lot more alarming when they can only get 2%.
Let’s look at some nice round numbers to understand this further:
Let us assume the fund has $1billion in assets.
Our 60/40 portfolio split see’s our portfolio allocation as $600,000,000 for stocks and $400,000,000 for bonds.
Historically, bond portfolios would return between 4–6% while stocks portfolios have returned 8–10%.
Let’s assume an 8% pension liability threshold, we need to achieve an 8% return on our investments in order to cover the outgoings and not erode our principal amount of $1billion.
Bonds, typically being the more stable asset are a bit easier to predict so we determine our return for the year is 6% this year. Good for us!! So 6% of our $400,000,000 = $24,000,000
Remember our requirement to remain solvent is 8%. Target return therefore = 0.08*$1billion = $80,000,000
Require return from stocks is therefore $80,000,000 — $24,000,000 = $56,000,000.
The required return as a % of the stock portfolio is therefore $56,000,000/$600,000,000 = 9.33%
By achieving 6% on our bonds, we need a return of 9.33% from our stock portfolio. We’ve got a great investment team, hopefully we are ok this year.
But…. the Fed have their QE program suppressing yields to 1% now due to recent market turmoil. This has impacted the whole bond market. Now, even by taking on a bit more risk by gaining more exposure to high-yield (low grade) bonds the best we can get for this coming year is 2%, assuming no defaults.
Let’s revisit our fund and crunch the numbers again.
New Bond Return: 0.02*$400,000,000 = $8,000,000
Required Stock Return: $80,000,000 — $8,000,000 = $72,000,000
New required return as a % of our stock portfolio: $72,000,000/$600,000,000 = 12%
Hmmm, now we might have a problem.
We have now worked out that we need 12% from our stock portfolio to remain in the black for the fund. The problem is, now every fund out there is chasing the same thing as us and as we also saw earlier that stock valuations are becoming higher and higher as everyone starts to chase this yield using the risk-free-rate-of-return as the yardstick.
The pension fund is forced to either accept lower returns and start eating into their principal, or chase more yield by taking on more risk. For the 1st option, for each year they allow their principal to erode, their required returns will increase due to this erosion of principal. This will put more pressure on them earning higher yield each and every year that this continues, digging a deeper and deeper hole. More often than not, they opt for option 2, chase higher by going further out on the risk curve, buying higher yield bonds (more risk) and buying riskier stocks trying to chase that higher return. Perhaps they look at their governance model and reassess the 60/40 portfolio split. Maybe they allocate more capital to the stock portfolio and make it 70/30 or 80/20?
One thing is for sure, more attention is turned toward the stock market for higher yields. With it comes more capital flows as they re-balance their portfolios. The old stalwart blue chips stocks go to the bottom of the value heap and in come the frothy growth stocks in the hopes of those elusive double digit returns.
Pension funds are but one example of how this search for yield among traditional funds are causing a shift in the traditional stalwart investment portfolio and thus concentrating more capital into the stock market. This increase in demand for stocks leads to higher prices. Institutional money flows, undoubtedly have dramatic effects on the overall markets valuations, but let us not totally forget the little guy either. This leads us to point 3, Passive Inflows.
3. Passive Inflows.
If you have read any of the popular investing books published in the past few decades including the bible of every self-proclaimed value investor, The Intelligent Investor by Benjamin Graham, there is a common theme that pops up frequently. Buy the market.
It has been proven time and time again that many professional money managers and actively managed mutual funds fail to beat the market. Active investment strategies, where analysts review market movements and pick individual stocks, often fall short of the overall market performance. Throw in a few % for active management fees and this failure to beat the market is further enhanced to the downside once we account for these fees. Why then would you pay someone exorbitant fees for the privilege of under-performing the market? Many won’t, and the trend is that more and more people aren’t. The fact most fund under-perform the market is becoming well known within investment circles and retail investors alike.
Graham, in The Intelligent Investor frequently highlighted that picking stocks can be difficult, and for those that lack the time, dedication, knowledge and passion for it, they should simply not do it. He advocated buying the index, getting exposure to the market as a whole. Doing this provides diversification within the stock universe and smooths out volatility and enhances returns. Many investment books published thereafter echoed the same thoughts and as we grew to understand human behaviour and market psychology, these thoughts were further supported by removing the emotion out of peoples trading behaviours.
As markets evolved so too did the investment vehicles available to investors. The introduction of Exchange Traded Funds gave exposure, liquidity, and tradability to investors. Once upon time if you had capital to deploy in a passive strategy, you gave your capital to a mutual fund. Many of these funds had specific structures and restrictions on the access to your capital. If for example, you needed access to your capital in a hurry, this was not always possible within short timeframes. Many funds would have a minimum lockup time of this capital or minimal terms as long as 12months notice to pull your funds out. The introduction of Exchange Traded Funds allowed investors to be able to get access to the benefits of a fund, but allowed them to trade units of the fund on the exchange just like they would individual stocks.
Within the exchange traded fund (ETF) universe we now have both actively managed and passively managed funds. Here is where we unlock the third piece of our puzzle that leads to higher asset bubbles, passively managed ETF’s.
Passively Managed ETF’s have become very popular in recent years, mainly due to their low fee structure and performance. There are many different ways that passively managed ETF’s are structured and many different ways you can get exposure to a variety of markets. There are ETF’s that provide exposure to bonds, stocks, even real estate. Within these broad headings you have ETF’s that track specific indices or markets or industries. For example there are ETF’s that focus on mining stocks, or emerging market stocks, or high-yield bonds or commercial real estate. Just about any combination of market and investment vehicle you can conceive, you will more than likely find an ETF for that covers it.
ETF’s are a great way for the investor to get exposure to a variety of investment vehicles without the need of reading (or understanding) financial reports or understanding macroeconomic factors or grasping how geopolitical tensions can impact markets. They are a one stop investment shop, park your currency, walk away and forget about it. Let the market sought it out.
Investors can deploy dollar-cost-averaging strategies within ETF’s to consistently build their wealth over time. And because they are traded on an exchange, they are considered very liquid, meaning you can usually unwind your position easily and get access to your capital as needed.
Index ETF’s in particular, are a very popular investment vehicle for investors. What exactly is an index ETF? A typcial stock index is simply an ETF that will buy all of the stocks that appear within a specific index. The index is a basket of stocks that meet a certain, predefined criteria. You are probably familiar with the popular index’s reported on within finance media such as the Dow Jones Index or the S&P500. These indices are a way that investors can keep abreast of the market movements as a whole. The S&P500 for example is an index created by Standards & Poor. This index contains the largest 500 companies traded within the US exchanges that meet specific selection criteria. We won’t get into the specifics of that criteria here however suffice to say for now that these 500 companies are simply the top 500 companies in terms of market cap within the investable, publicly traded companies on the US stock exchanges.
An ETF that tracks the S&P500 would therefore be an exchange traded fund that passively (meaning no further thought or selection process or bias is considered) buys a market weighted allocation of these 500 stocks for every dollar that flows into the fund.
As of June 2021 the total market cap of the 500 companies that make up the S&P500 index are valued at ~$36 trillion dollars. Each company within the universe therefore makes up a % of this total of $36trillion according to their individual company market caps. Figure 2 provides a list of the current top 10 (July 2021)
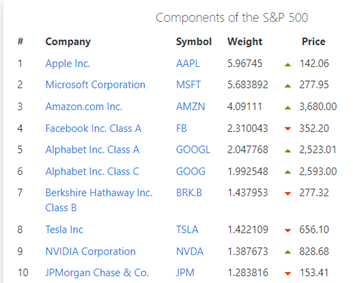
Figure 2. Top 10 Stocks SP500 — source < https://www.slickcharts.com/sp500>
Apple Inc, being the largest company in terms of market cap makes up nearly 6% of this total market cap. While a company like Ralph Lauren is one of the smallest and makes up just 0.015% of the market weighting. The top 10 stocks within the S&P500 account for over 25% of the total market cap. It is easy then for these 10 companies alone, to influence the entire index performance as a whole, as has been the case through 2020–21.
Why is this important? It is important because of the passive flows. More and more retail investment capital is flowing into these passive investment vehicles. In Australia we are accustomed to our superannuation scheme. A % of our income is automatically allocated into superannuation funds to invest for our retirement. Much of this is actively managed, but a portion is passively managed, and super funds use ETF’s like these to invest on their behalf. the US have their 401k investment system. The 401k system is a defined contribution plan where employees can make contributions to their retirement accounts alongside the option of additional employer contributions. The investment of these funds however is often directly managed by the employee themselves. And you guessed it, the majority of this capital ends up being invested into passive vehicles like index ETF’s.
The problem here is that these passive inflows into the markets are distorting price signals. The massive wall of money that continually flows into the markets are removing the natural price discovery that exists between normal supply/demand economics.
When professional institutions actively invest, they are digging through the financials, checking balance sheets, conducting DCF models and trying to determine the intrinsic value of these stocks while trying to determine if the stock is trading at a premium or at a discount to their valuations.
The passive index funds are not doing any of this price discovery. They are mandated by their structure and governance to go and blindly invest all capital into the index they track at the index market weighting for each stock.
That means, for every $1 that flows into the fund, they are automatically buying $0.06 worth of Apple stock and $0.0015 of Ralph Lauren stock. No matter if the stock is overvalued or not. It doesn’t matter if Tesla is trading at 1000 x price to earnings (Warren buffet likes to keep PE under 15), every $1 that flows into a passive index fund will automatically allocate ~0.014 to Tesla stock, in line with its market weighting contribution to the index.
The popularity of passive index funds has grown enormously over the years and for many of the good reasons we have highlighted already, it is hard to beat the market so just buy the market. But these large capital flows are removing that normal price discovery that would otherwise be found. It is estimated that as much as 45% share of market funds are within passively managed funds, meaning that half of the demand, that is chasing the supply, doesn’t care at what price it pays for the stock. They will just continue to buy stock at any price. This is an alarming statistic and does indeed help to explain why the stock market appears to be so overbought.
Bringing it home
There are a number of financial institutions that are mandated to by their charters to purchase certain kinds of instruments, to deviate from stock/bond portfolios is very hard for them to do. They can’t sit in cash, they must deploy these funds as per their charter. Some, like these pension funds discussed, must not only deploy these funds, they have outgoings that dictate the yield they are required to achieve just to remain solvent.
Artificially depressed yields force asset prices to soar, institutions are mandated to pay the price for these stocks to simply get the exposure to stocks that they are mandated to maintain.
The Cantillon effect means the wealthy get first access to the capital and acquire the assets first before they soar.
Retail investors continue to blindly pour their capital into the bucket chasing these prices higher as they go, all while using no price-discovery through the process, guaranteeing they pay top dollar through this bubble period.
But ask yourself, with everything we have learned, why aren’t these prices parabolic? Why don’t they exactly match the M1 money supply curve? Why do we still see market draw downs and small sell-offs and why are these sell-off’s quickly bought back up?
In order for there to be a sell-off someone has to be selling right? Someone is selling enough into each of these rallies each and every time. Who are they? They are the people who are not mandated by their charters to have certain allocations to certain investment vehicles. They are the people with high net worth’s who can employ the best of the best to do the work for them, evaluating what is undervalued and what is extremely overvalued. These are the people that understand the market structure and they understand that nearly half of the the capital that comes into the market will blindly purchase the stocks at any price. For every purchase there is a seller, ask yourself which side are you on? Are you the person buying anything and everything at top dollar (and yes this includes Aussies with funds in Super) or are you the person who knows the stock is overvalued, gets access to the free currency first, buys the assets first and sells into each and every rally?
Conclusion
Nearly every single stock within the main global market is priced high in 2021, when using traditional discounted cash flow models. I hope I was able to highlight just a couple of reasons that this may be the case, the search for yield, the risk-free-rate-of-return and the passive inflows really do account for a lot of what we have lost in terms of normal price discovery in a free and open market. It is common to see stocks trading at large multiples of their earnings, even large multiples of their revenues. But the Average Joe is none-the-wiser. The books we have read have encouraged us to use these vehicles like passively managed funds. But when we do, our capital is competing with these indebted pension funds struggling to remain solvent, and the sky-high stock valuations from the guys who “know what they are doing”. This competition keeps fuelling the fire leading to even higher valuations. All the while, high-net-worth individuals and family-offices happy unload their bags.
The Fed is caught in a perpetual loop of constant currency debasement through money printing and QE. This in turn puts accelerant on the fire through the Cantillon effect (which we have learned about in previous articles), as this currency finds its way into asset prices. The suppression of yields then fuels the asset bubble further as we have highlighted in this article.
So, what is the Average Joe to do? We have seen that currency goes backwards through inflation, we have no reward by holding currency within the banking system as there is no return for the risk we are exposed to for doing so (and make no mistake, we do indeed carry significant risk with banks, this will be the topic of my next article). Assets are being pushed further and further out of reach by a system that can topple over whenever the Fed decides they have had enough. When they do decide this, the bubble pops; if they don’t the currency collapses (see Weimar Republic 1920’s), or it implodes upon itself through other means via a black swan event we don’t see coming.
The honest and truthful answer, and the asset class I keep coming back to time and time again, the more I learn about this crazy financial system, is Hard Money. Gold, Silver and Bitcoin. It is the only asset class we have left as middle/low income earners. And it is evident that this is where the wealthy are also turning. When they sell us these assets, they aren’t keeping it in cash and they aren’t keeping it in bonds. These large players are making moves now to allow their governance models to own bitcoin, and there is plenty of evidence to support this trend.
Unfortunately for us, the big boys have ways of manipulating precious metals and crypto markets alike, and they have been doing so. The fortunate side for us, is that it means these prices are artificially depressed. I much prefer artificially depressed prices than I do artificially inflated prices. Now is the perfect time to be buying these assets, when they are depressed. The wealthy, own the media outlets, and they spread Fear, Uncertainty and Doubt (FUD) about assets like bitcoin, shaking new entrants and scaring them out of their positions, the on-chain metrics support this. Read this article to understand more.
There is simply no other way to protect ourselves from the financial tyranny of central banks other than with hard-money. They have to keep doing what they are doing and they will do so for as long as they can. That doesn’t mean stocks won’t go up more from here, and that you can’t increase wealth in the interim, but we are doing it at the whim of central banks, this is not a free and open market, they can turn off the taps whenever it suits them, that is why I don’t like the markets at the moment. I understand the plumbing more than a lot of people I know, hence why I write these articles, and I am scared to death.
Bitcoin is hope. Bitcoin is the best way for the Average Joe to protect what they work so hard to accumulate. We don’t benefit from this continual pumping of the asset bubble, because we don’t own enough of the assets yet, we are still trying to accumulate them. But this charade will end one day and it will end badly. Sure, we will benefit from anything we may own now in the interim, but will we get adequate signal before those in power decide its coming undone? Would we recognise that signal if/when it does surface? Will the media tell us to start unwinding our assets or will we continue to hear things like “Inflation is transitory”, “We will raise interest rates in 2024”, “Tapering of the money printing will start soon”. Did they give us fair warning in 2008? Who lost out? The banks got bailed out by the taxpayer, asset valuations got crushed but many of the big boys unwound early enough or got bailed out. Mom and Dad’s retirement accounts got completely wiped out. Where was their bail-out?
The system is designed a certain way, and for the most part it keeps us healthy and employed (mostly). But it also keeps us as slaves for wages. It is teetering on the edge of instability and the only way it keeps afloat is through currency debasement which hollows out the middle class. The only thing we can do is to educate ourselves and prepare ourselves and maybe, just maybe we can actually benefit from what is an inevitability, when this whole thing unwinds. It might be a year from now, it might be in 20years. For now, there is no better asset I want to swap my hard-earned currency for other than for hard money. Please understand though, in a market sell-off, gold, silver and bitcoin will most likely suffer short term too. Don’t be panicked. When markets sell off, people cover their margins, they sell everything and flood into the USD, this will drag precious metals and bitcoin down too, but they will be fast to recover. To reiterate, the Average Joe won’t get enough signal to act and sell before the big boys, but sitting in cash between now and then ensures you go backwards.
When the currency debasement unwinds, the prices of these hard money assets will soar shortly after. When this does happen, the asset prices collapse. I will then look at swapping my appreciated hard-money for the depressed assets and grow my wealth that way. It is silly to try and acquire assets when they are at all-time-highs. Stocks potentioal to keep going up is limited from here. To be honest, I probably won’t swap my bitcoin for other assets, gold and silver yes, but not my bitcoin. I will more than likely borrow against it. This will be covered in more detail in future articles.
Remember, pension funds chasing 12% yields won’t be able to maintain this year on year, there is simply not 12% compounding growth available from the current levels of stocks. More and more people are looking to retire and lock-downs are causing more and more employment issues. An increase in the retirement rate will increase the pension liabilities meaning they will need to seek even more yield. This is not going to end well, the writing is on the wall if we care to take the time to read it.
We want to be accumulating assets now that will protect us in a downturn. We want to be selling assets when they are at all-time-highs, not buying them. We should be prepared for a big market sell-off, positioning ourselves to benefit from it when it does arrive. But cash is not your friend.
Bitcoin Gold and Silver are scarce, central banks can’t print more of it, they can’t print it out of thin air, they have no control over its debasement. But all 3 will go up in their purchasing power over time. I believe bitcoin accelerates faster than the others, it is still an undervalued asset class, it is still considered fringe, but I can promise you the professional money is moving now.
Use dollar-cost-averaging strategies to buy bitcoin and iron out any volatility, swap your excess fiat currency outside of your emergency funds (whatever that means for you) into hard money like bitcoin. See my previous article on inflation for examples of how to dollar-cost-average (DCA) and the benefits it provides.
Stack hard money while other assets are overpriced and wait for the days to hit the financial equivalent of the black Friday sales. When do you buy electronics or clothing? When they are on sale that’s when. Why is the stock market any different? Downturns do happen, they call the ups and downs “cycles”, we are in a massive cycle now that will someday unwind, what goes up must come down. Will you be ready?
Thanks so much for reading.
Daz Bea
Twitter: @dazbea1
Recommended Reading
The Warren Buffet Accounting Book– Preston Pysh and Stig Brodersen.