

✌️ Welcome to the latest issue of The Informationist, the newsletter that makes you smarter in just a few minutes each week.
🙌 The Informationist takes one current event or complicated concept and simplifies it for you in bullet points and easy to understand text.
🧠 Sound smart? Feed your brain with weekly issues sent directly to your inbox here
Today’s Bullets:
- What are Bond Ratings?
- How are Bond Ratings Determined?
- What’s a CDS Spread?
- How are CDS Spreads Priced?
- Which can we trust?
Inspirational Tweet:
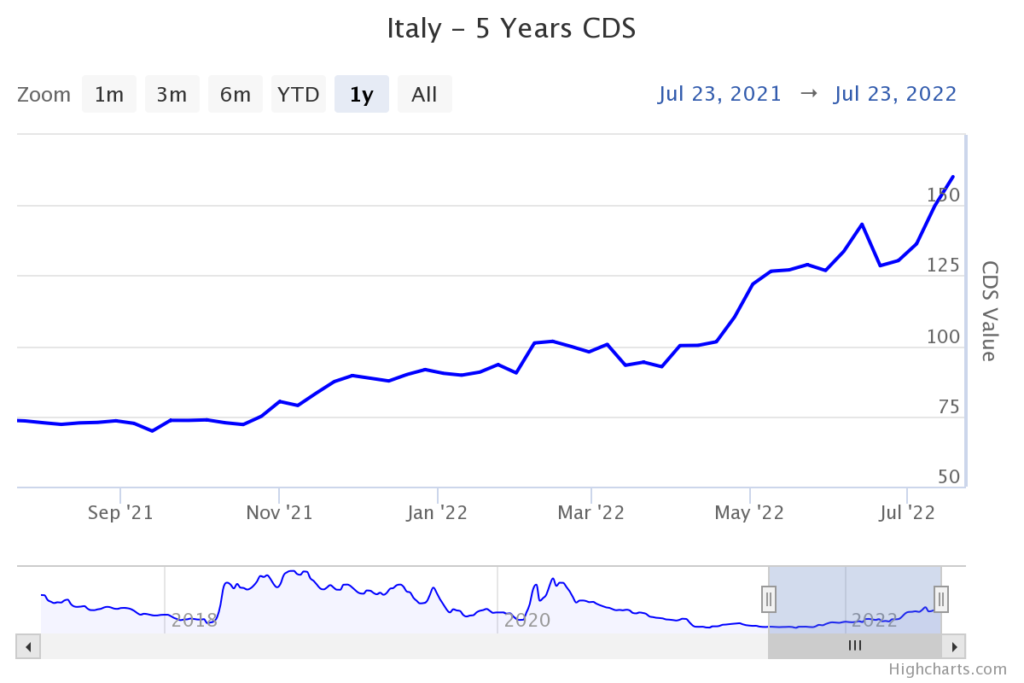
Italian CDS Reaccelerates towards its cycle high pic.twitter.com/KMl2usM7ex
— Hedgeye (@Hedgeye) July 15, 2022
We have seen the drama unfolding in the EU, with the ECB attempting to raise rates without negatively impacting their southern countries, and as pointed out by @Hedgeye, the CDS market has sussed out some possible problems ahead.
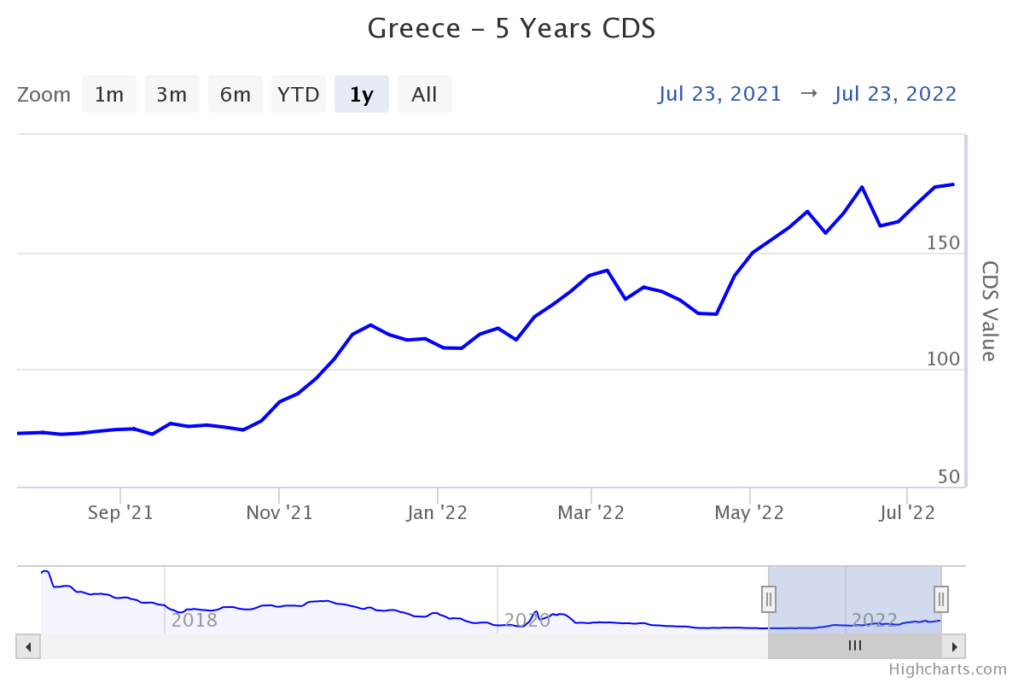
We suspect that Italy and Greece in particular are exposed to credit issues if rates get too high, and the CDS market is confirming this suspicion. Yet the credit ratings for these countries haven’t changed. How and why?
Let’s break it down, shall we?
🔠 What are Bond Ratings?
We’ve talked about credit agencies and bond ratings before, but let’s have a bit of a refresher here to catch everyone up.
First, just like credit agencies review and score individuals’ credit-worthiness, similar agencies do the same with companies and countries, by giving them a rating. As you know, your credit score can significantly impact your ability to borrow money, i.e., get a car loan or mortgage, or even a credit card. Companies face the same challenge, in that a poor rating can affect their ability to issue a bond (borrow money) at an attractive rate in order to maximize (or sometimes save) their company’s business and profitability.
And similar to consumers, bond issuers also have three main agencies judging them. In the US, we have Standard and Poor’s, Moody’s, and Fitch. They have their own grading systems (see chart below), but lean on each other and rarely make a large move without other agencies also doing so.
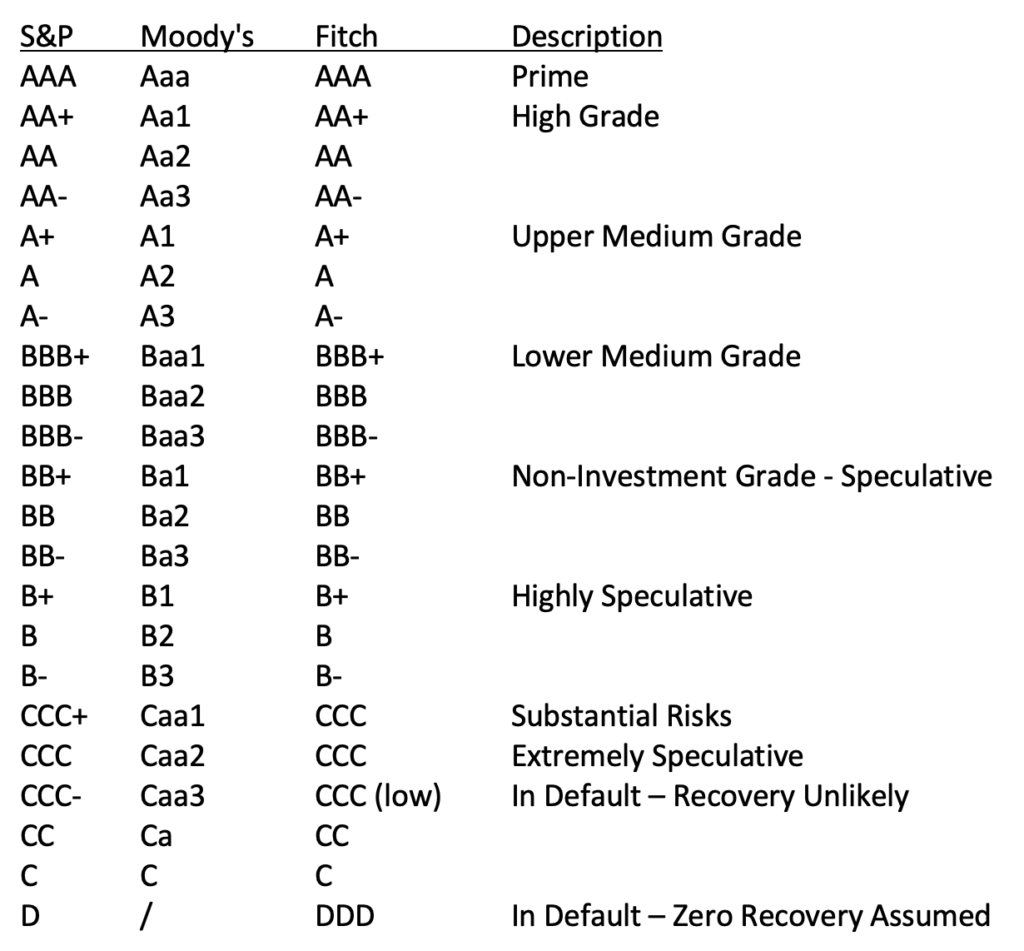
A score of AAA denotes an entity as a Prime borrower and signals they are the lowest risk to lenders. This score is generally reserved for the strongest countries and a handful of companies at most. Same for countries, with only Germany, Australia, Singapore, and a handful of European countries currently receiving the highest ratings from all three agencies.
And the equivalent of sub-prime for the bond credit scale is when a sovereign or company falls below BBB-. At this point, they are no longer considered Investment Grade by the ratings agencies and are considered junk grade to investors.
🤓 How are Bond Ratings Determined?
Bond rating calculations and determinations can be quite intricate and complicated. Additionally, they can vary widely between types of entities and companies being rated.
For instance, a bank rating may include factors such as debt to equity ratios and also book values and quality of deposits, while a technology company rating may include book to sales ratios and inventory turns. In other words, specific measures are used for specific industries, and certain external factors may affect scoring as well.
Additionally, external factors are also taken into consideration for the scoring. If a separate entity or government agency has an impact to the overall business of the entity being scored, then that is also considered. The credit quality of all related parties become a factor in the final scoring.
If you are interested in the actual process and methods of each of the agencies, they publish them periodically and specifically for each of the different types of companies or entities they research. You can find the methodology reports on the ratings agencies’ websites.
As an example, here’s a table that shows the process Fitch uses to rate sovereign debt:
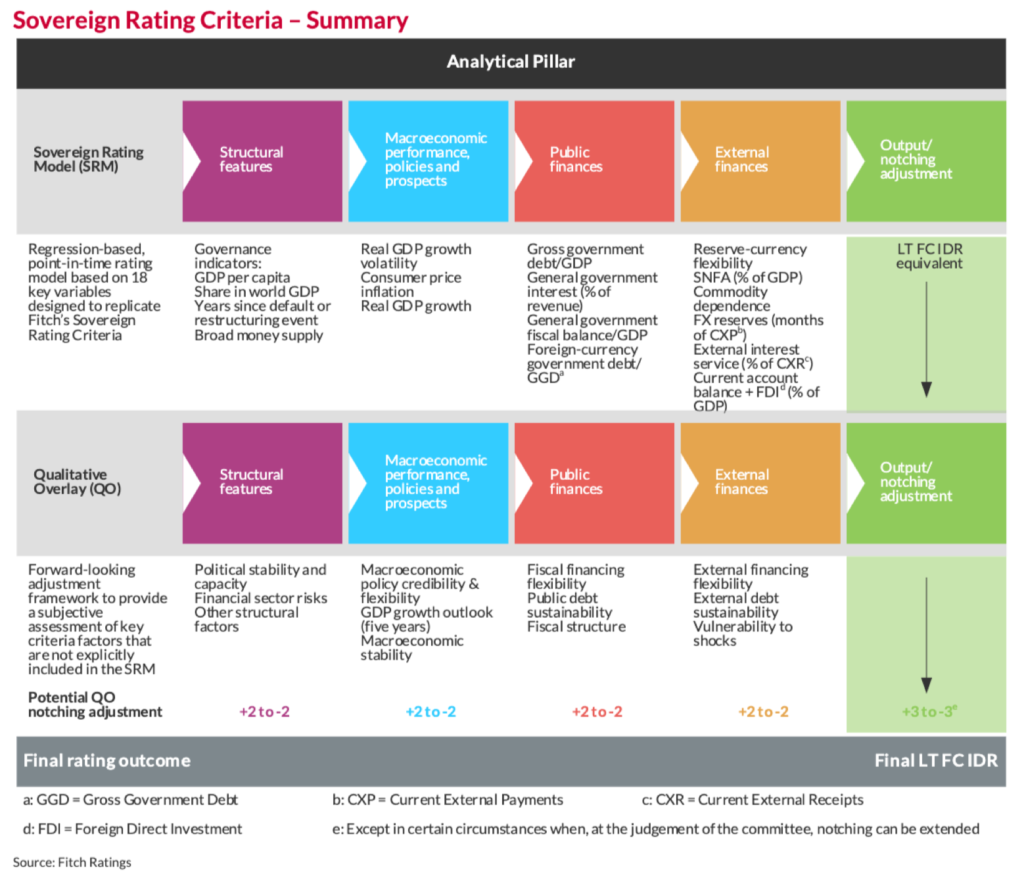
Fitch Ratings of Sovereigns
But when it is all said and done, each credit scoring agency boils it down to three letters or less to give a super fast indication of an entity’s credit quality for investors.
😮 What’s a CDS Spread?
You may have heard me talk about Credit Default Swaps (CDSs) before, or remember the term from the Great Financial Crisis of 2008. But let’s review quickly to get everyone up to speed.
First, a swap is a contract between two parties (like a legal document) that agrees to swap one risk for another. Simple as that. In the case of the housing crisis, CDSs were used to protect against the risk of mortgages defaulting. Owners of the debt could protect themselves by buying the corresponding CDS ‘insurance’.
However, unlike typical insurance, you don’t have to actually own what you are insuring when you buy a CDS. You just buy the insurance from whoever is willing to sell it to you. Like buying insurance on your neighbors’ house. If it floods or burns down, you each get an insurance payout.
Why would someone sell you that?
Simple. It’s all about probabilities and premiums. The seller is making a bet that the bonds do not default, and that they will collect the insurance premiums for a profit.
🤯 How are CDS Spreads Priced?
A CDS spread is the the calculated annual premium the CDS buyer must pay the CDS seller (remember this is just a legal agreement, a swap) over the length of the agreement, calculated as a percentage of the notional amount.
In English, please.
OK. Let’s say you want default protection on $1 million of Italian Government bonds, which currently costs $16,490 per year. Then the CDS spread on Italian Government bonds bonds is therefore listed as 1.649%.
And, using that spread premium along with what one could expect to recover from an actual default in the bond that is being insured, we can calculate the implied probability of an actual default, according to the market pricing.
In other words, the price of the CDS spread is telling you both the likelihood of a default and the expected amount of recovery after that default. See, if there is a high expected probability of default but also a high recovery expected (amount the bondholder will recover from the face value of the defaulted bond), then the price of the CDS will be lower than if the expected recovery was low.
Back to English: If you expect a default and don’t expect much recovery from it, then you’ll pay more for the insurance.
In our Italian Bond CDS, if we assume a 40% recovery of the face value ($400K) if the bonds default, and using the 1.649% CDS spread, then we can calculate the implied probability of default to be 2.75%.
1.649 / (1.00 – .40) = 2.75%
and if we think the recovery is 60% ($600K), then:
1.649 / (1.00 – .60) = 4.12%
so the implied probability of default is then 4.12%.
🤥 Which can we trust?
So, as an investor, which one of these systems, or clues, should you be paying attention to more when making an investment decision? Credit ratings or CDS spreads?
Do you believe the credit agencies and their analysis and published ratings or do you believe the markets themselves and the buyers and sellers of the actual insurance against default of the credits being rated?
Well, let’s take a peek at a couple of sovereigns to see what the market says versus what the ratings agencies say.
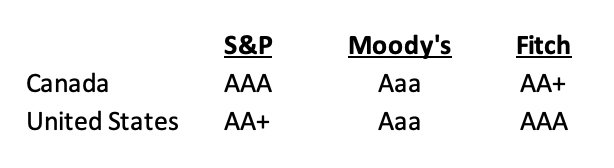
As of today, Canada and the United States share almost the exact same sovereign debt rating by the agencies:
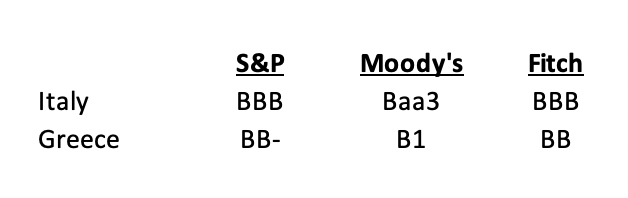
While Italy and Greece have substantially lower ratings.
In June of 2020, Fitch downgraded Canada’s rating from AAA to AA+, but the other agencies left them top rated. And the US was downgraded in 2011 by S&P from AAA to AA+, but has remained the same since, and the other agencies maintain their top rating.
Now let’s have a peek at the CDS markets. Currently, the CDS spreads are priced as follows:
United States: 0.20%
Canada: 0.33%
Italy: 1.65%
Greece: 1.79%
This seems relatively reasonable, and using a 40% recovery expectation, the implied probability of default for each is:
United States: 0.34%
Canada: 0.56%
Italy: 2.75%
Greece: 2.98%
Now hold on a second. At first glance, it appears reasonable to assume that the US and Canada both have less than 1% chance of defaulting on their debt. They are both nearly perfectly rated and their ratings have remained stable for a long time.
However, how is it that they are rated pretty much exactly the same by the agencies, yet Canada is priced to be twice as likely to default as the United States, assuming the same recovery?
This tells you that Canada is, in fact, not as financially strong as the United States. At least according to the markets, that is.
And what about Italy and Greece?
Greece’s ratings are a solid notch below Italy across the board, yet the CDS spreads are almost the same. What does the market know that the agencies either don’t know or are ignoring? A lot has been said about the failures of the agencies keeping up with market developments and changes, and have sometimes been accused of playing favorites or being easy on their customers.
After all, the credit rating agencies usually provide ratings at the request of the institutions themselves. There’s no way around the fact that this is an inherent conflict of interest.
Another major factor at play here may be simple timing. The ratings are often old and stale, and don’t take into consideration the recent events in the markets or in the economy.
So, one of the most important aspects of the CDS prices is the movement of them. Are they going up or down? And how quickly are they moving? What is their velocity?
Knowing what has been happening in Europe and the issues the ECB is facing with raising interest rates and causing stress in the Italian and Greek bond markets, it is no surprise to see that the CDS rates of both those countries have been rising.
When you start to see the prices of CDSs rise, this means bond holders and traders are hedging for what they perceive as an elevated risk of default. After all, who are you going to trust most when looking for clues about the strength of a company or country, an agency paid by that entity to analyze it? Or investors and traders who actually own the underlying risk of that entity?
Is it any surprise then that one week before the collapse of Lehman Brothers, the agencies all had their debt rated as A or better? At the same time, however, this is what the CDS market looked like:
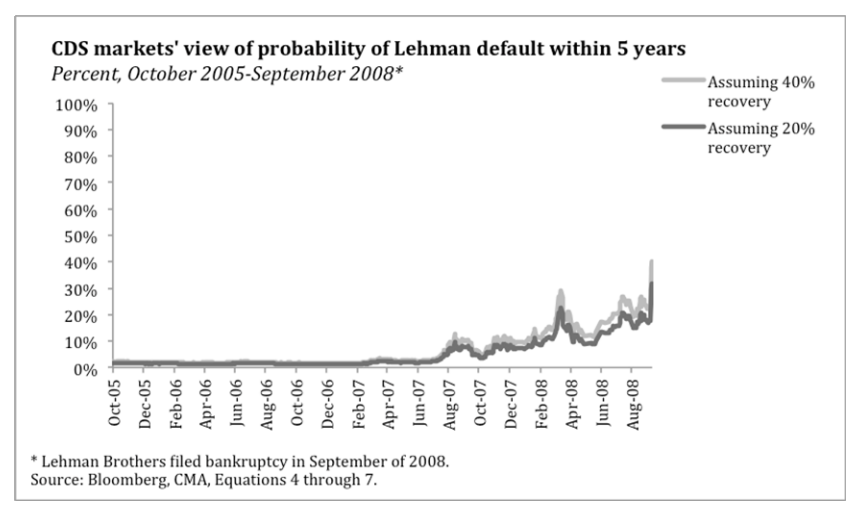
Bottom line, watching the prices of CDSs will give you a more timely and accurate view of possible or probable problems in companies and countries as an investor. This is exactly where I go for clues that there are problems brewing in any country or company, and just how bad they may be.
And so, if you’re interested in gauging the CDS spreads yourself, you can find current Sovereign Debt CDS pricing here:
World Government Bond CDS Prices
That’s it. I hope you feel a little bit smarter knowing about credit ratings and CDS spreads and are ready to start incorporating CDS monitoring in your own investing.
As always, feel free to respond to this newsletter with questions or future topics of interest!
✌️Talk soon,
James


Fantastic explanation. Thank you.
Will be rereading.
Thanks so much Julio. We are very blessed to have James as a part of team Looking Glass.